A portfolio of strategies
Better risk-adjusted returns by optimizing a combination of mean reversion and momentum
The idea
“Don't look for the needle in the haystack. Just buy the haystack.” Jack Bogle.
Harry Markowitz's Modern Portfolio Theory (MPT) revolutionized the field of investment management by providing a quantitative framework for portfolio construction and diversification. He is considered the father of the MPT.
However, it was Jack Bogle who popularized the practical application of these principles by founding The Vanguard Group and creating the first index mutual fund, making low-cost, diversified investing accessible to everyone. He gave birth to a trillion-dollar industry.
Say whatever you want to say; at least to me, Jack is the true father of diversification.
Also, from all quotes about this theme, I think his is the most insightful. :)
This week's article is about diversification. We will combine a mean reversion strategy with a momentum strategy, creating a portfolio of diversified uncorrelated strategies that is better than any individual strategy.
Here's our plan:
First, we will review the mean reversion strategy & the momentum strategy shared some weeks ago;
Then, we will improve the momentum strategy;
Finally, we will combine them, optimizing for risk-adjusted returns.
Individual strategies
Mean reversion
Some weeks ago, we developed a Mean Reversion strategy based on the following rules:
We split our capital into 3 slots and buy stocks that trigger the entry rule: when it closes under the lower band,* and IBS is lower than 0.3, we go long at the next open;
If there are more than 3 stocks in the universe with the entry signal triggered, we sort them by volatility (Normalized Average True Range) and prioritize the most volatile ones;
We hold 3 positions maximum at any given moment;
When the stock closes above yesterday's high, we exit on the next open;
Also, we close the trade whenever the price is lower than the 200-day SMA;
We only trade stocks whose price is above $10 and is above its 200-day SMA;
We restrict ourselves to trading only S&P 500 constituents (using a survivorship bias-free dataset).
*Please check the article for all implementation details and the complete thought process.
Here are the results we achieved:

The annual return was 26.4%, over 4x the benchmark during the period. The strategy delivered a 0.98 Sharpe Ratio. However, it achieved a 46% max drawdown, which is pretty high.
Nevertheless, I believe the strategy is ready to be combined with another one in a portfolio of strategies as it is.
Now, let's check the momentum strategy.
Momentum
Last week, we developed a Momentum Long & Short Equities portfolio based on the following rules:
On the first trading day of every week, we rank the top 500 stocks in terms of market cap according to their momentum factor;
We long the top 50 and short the bottom 50, with equal weights to each stock;
We use all available capital (the cash available and the proceeds from the shorts) to long the stocks.
This resulted in the following numbers:

Please check last week's article for details about the momentum factor and the thought process involved in achieving these results.
The problem with these numbers is that although the strategy reached 28% annual returns (over 4x the benchmark), the maximum drawdown is 80%. That's too high!
What could we do to reduce these drawdowns?
Improving the momentum strategy
While discussing the strategy with some colleagues, it occurred to me that the strategy is 100% net long all the time! This is totally sub-optimal.
So, let's re-run the momentum strategy with the following change:
Whenever the S&P 500 closes below its 200-day SMA (i.e., bear markets), we make the portfolio dollar-neutral (i.e., the total value of the long positions equals the total value of the short positions);
When the S&P 500 closes above its 200-day SMA (i.e., bull markets), we continue 100% net long (i.e., we use all cash available, including the proceedings from the short positions, to fund the long positions).
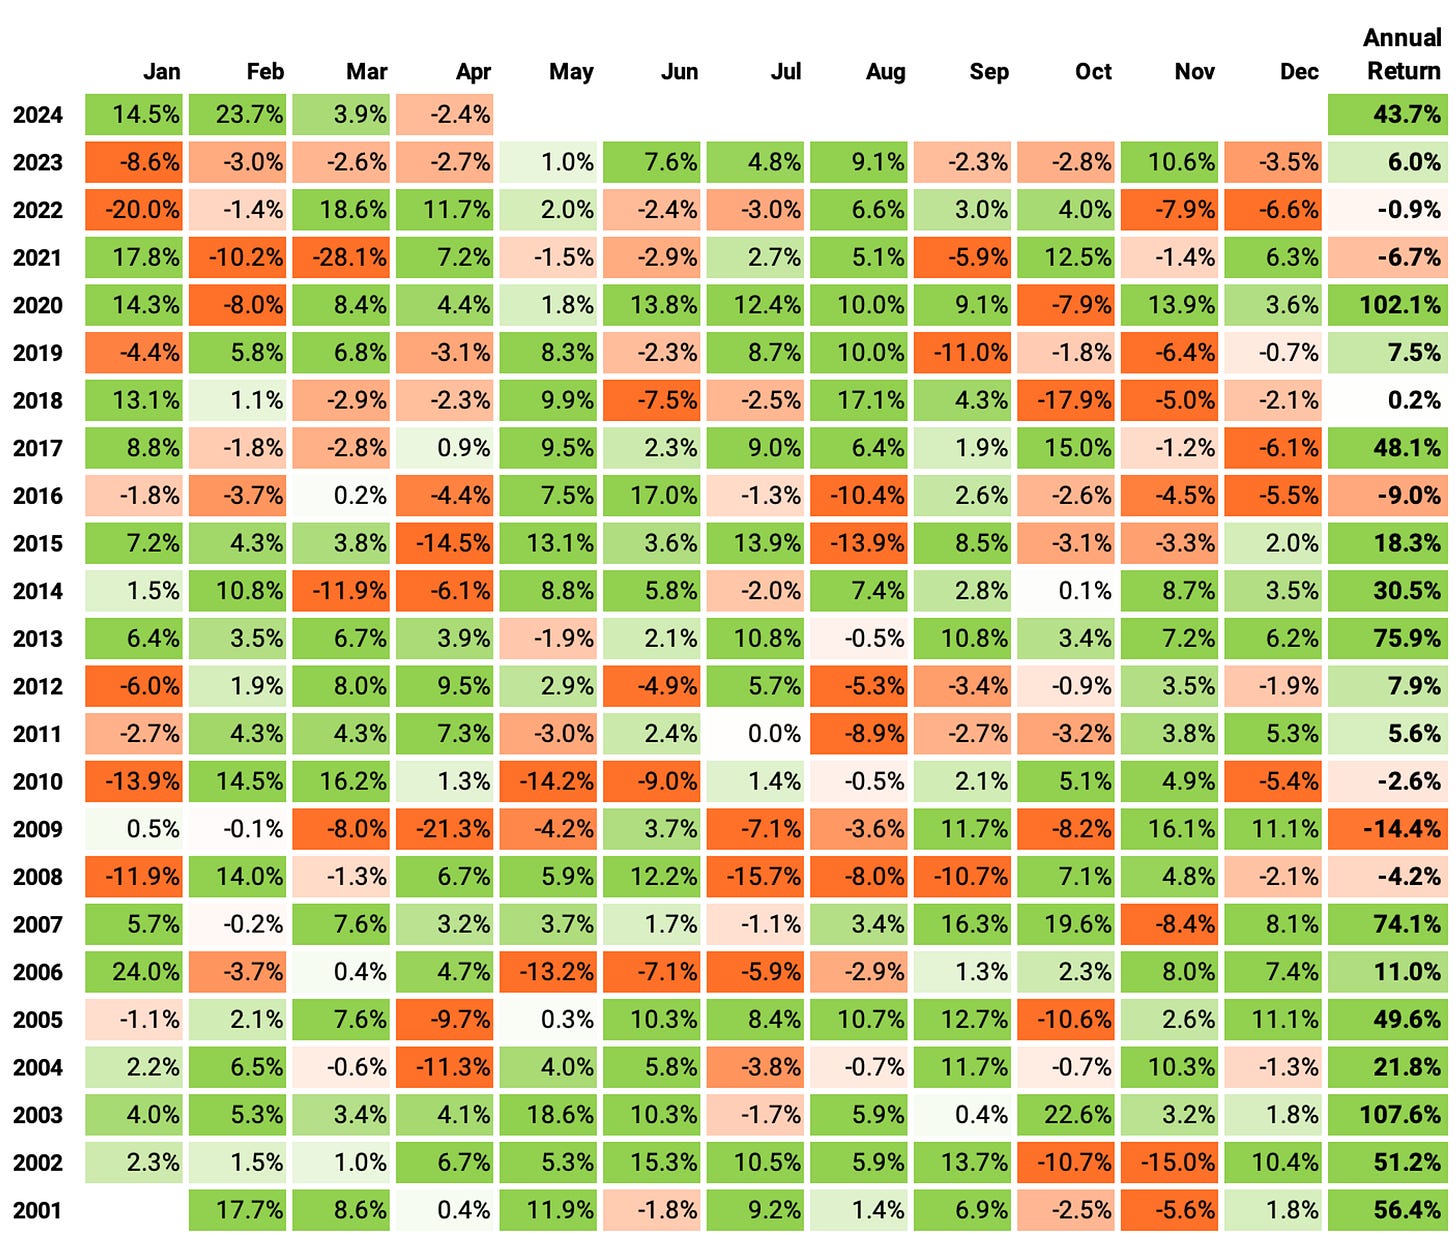
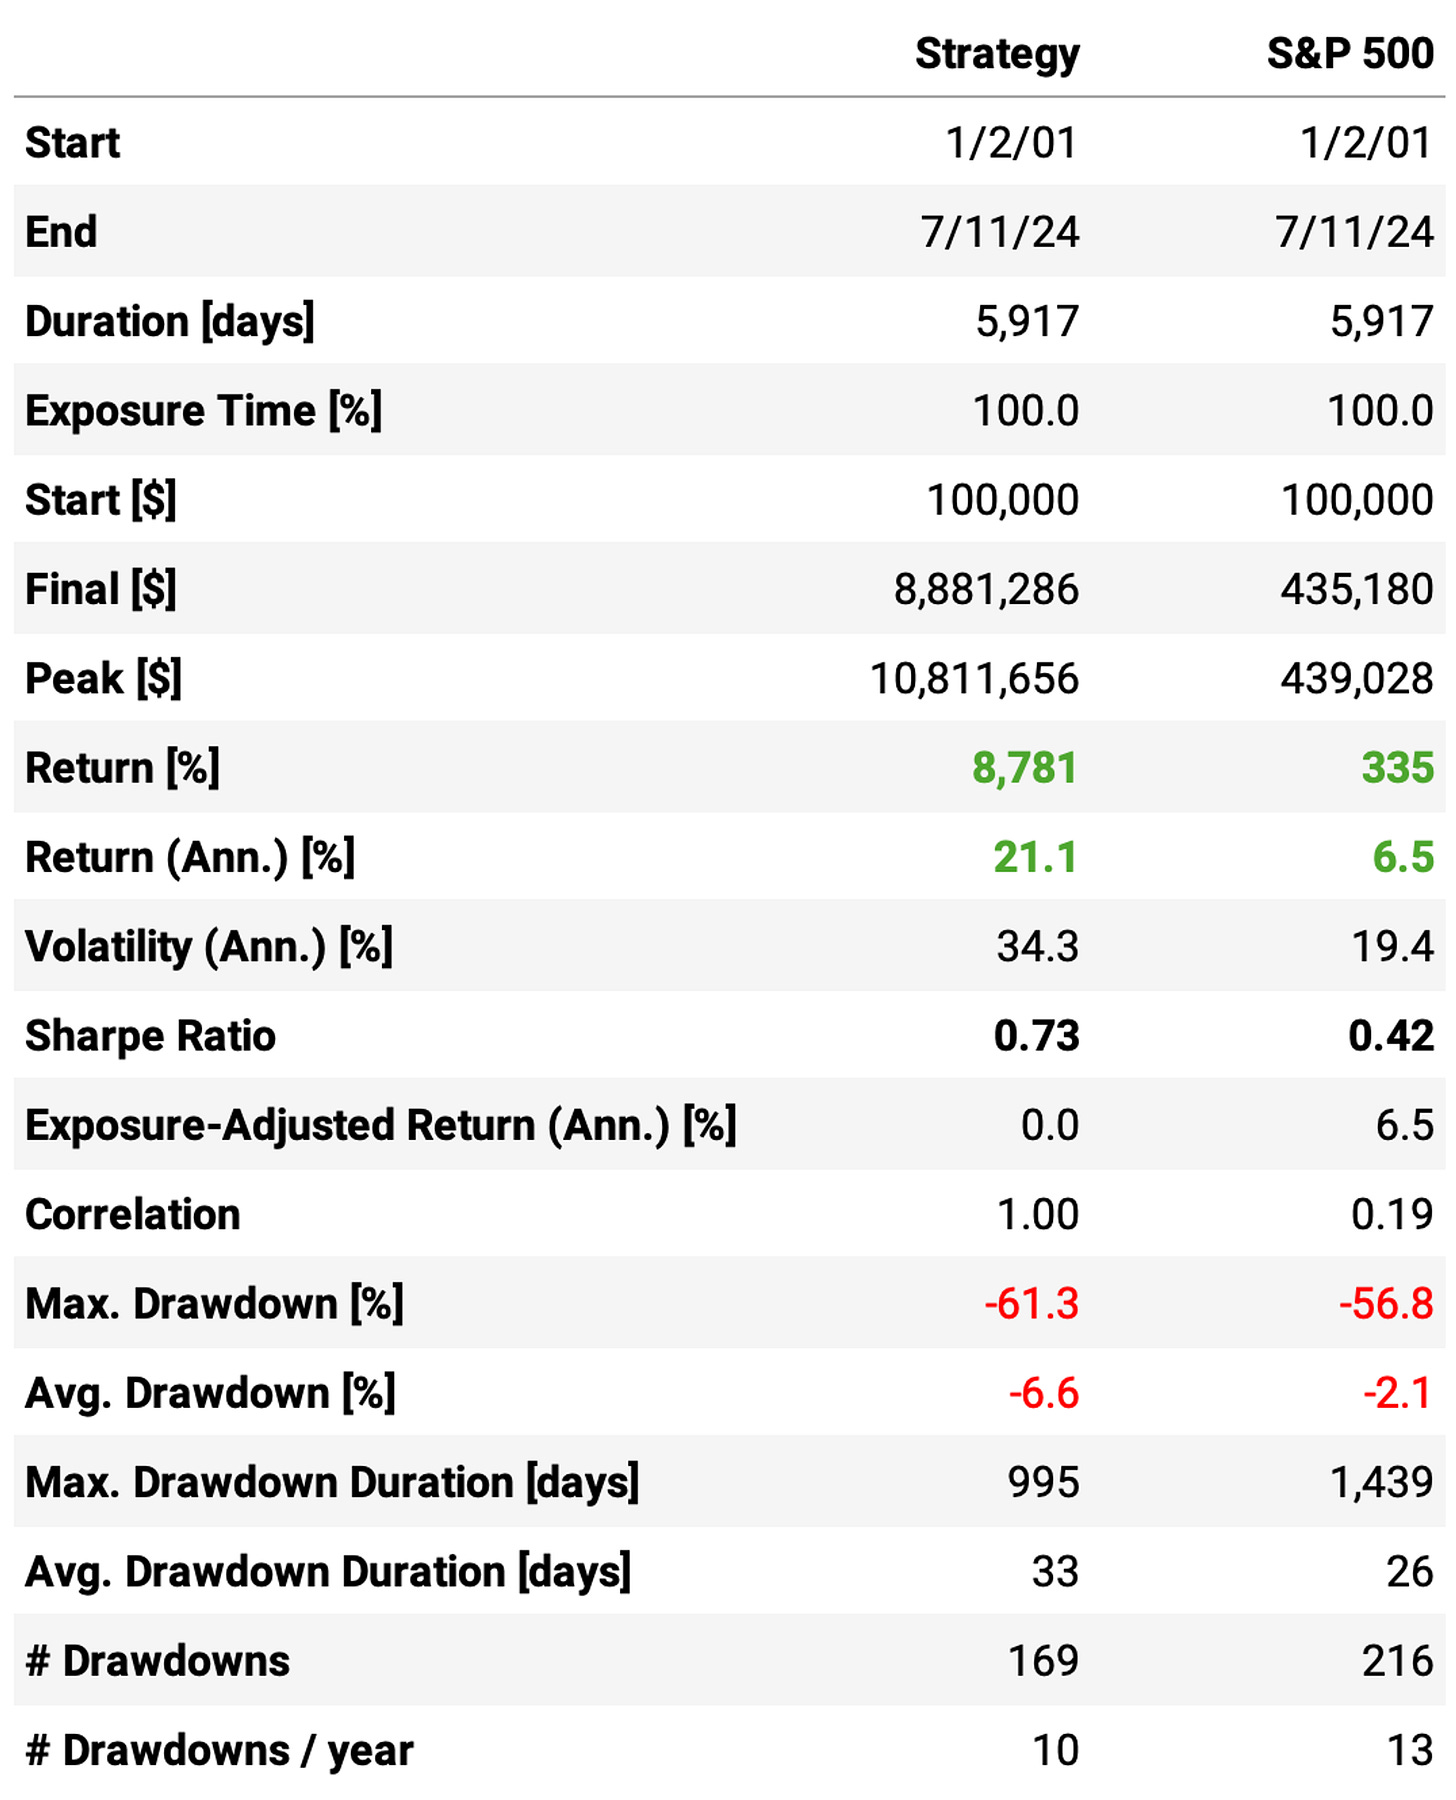
Adopting this strategy change, here's what we get:
These are better results:
The strategy achieves 25% annual returns instead of the previous 27.9%, but the maximum drawdown reduces from 80% to 52%;
The Sharpe ratio increased to 0.87.
Although better, the maximum drawdown, at 52%, is still too high. What could we do to improve?
Reducing the number of transactions
Before we consider improving the maximum drawdown by combining both strategies, let's address something that bothers me: the high number of transactions in this momentum strategy.
Doing 50 longs and 50 shorts with weekly rebalancing leads to approx. 6,400 transactions/year. That's too much.
Instead, let's do 15 longs and 15 shorts with monthly rebalancing.
This results in approx. 530 transactions/year on average, more in line with the mean reversion strategy (approx. 300 transactions/year). I know that the results will be a bit worse than what the previous run, but this is more manageable.

Although these numbers are slightly worse than the momentum with 50 longs/50 shorts and weekly rebalancing, doing 15 longs/15 shorts and monthly rebalancing makes the execution much simpler. The number of transactions is one order of magnitude lower.
Now, based on this version of the momentum strategy and the mean reversion strategy we saw in the beginning, let's try and improve the risk-adjusted returns.
Optimizing for risk-adjusted returns
The modern portfolio theory (MPT) says that:
Diversification: Spreading investments across a variety of assets can reduce risk without necessarily sacrificing returns. By diversifying, we can create a portfolio that has lower overall volatility compared to individual assets.
Expected Return and Risk: we should consider both the expected return and the risk (standard deviation) of their investment portfolio. The goal is to maximize returns for a given level of risk or to minimize risk for a given level of expected return.
Efficient Frontier: There exists a set of optimal portfolios that offer the highest expected return for a given level of risk. These portfolios lie on the "efficient frontier," and we should aim to construct portfolios that fall on this curve.
Covariance and Correlation: The relationship between the returns of different assets (measured by covariance and correlation) is crucial in constructing an efficient portfolio. By combining assets with low or negative correlations, we can reduce the overall risk of the portfolio.
Combining assets with low or negative correlations is a fundamental principle of Modern Portfolio Theory. Let's see how correlated the mean reversion strategy is to the momentum strategy:
Both strategies are reasonably uncorrelated: the average correlation is 0.29, with 80% of the values between 0.21 and 0.46.
Now, we are ready to run a portfolio optimization procedure, creating a portfolio combining both strategies.
Naïve optimization
The naïve optimization is just taking both revenue streams, from the mean reversion strategy and the momentum strategy, and running a simple optimization method to maximize Sharpe using all available data.
This is a naïve process because it uses all available data. We don't know if the results will hold in the future - probably not, as the weights are completely optimized to all past data. I decided to include it here so we can compare it with a more robust optimization procedure (using walk forward optimization), which we will see in a moment.
Here are the results of the naïve process:
Using all data to optimize backward, the optimizer found that the allocation that would have maximized Sharpe would have been:
Mean reversion: 75.3%
Momentum: 24.7%
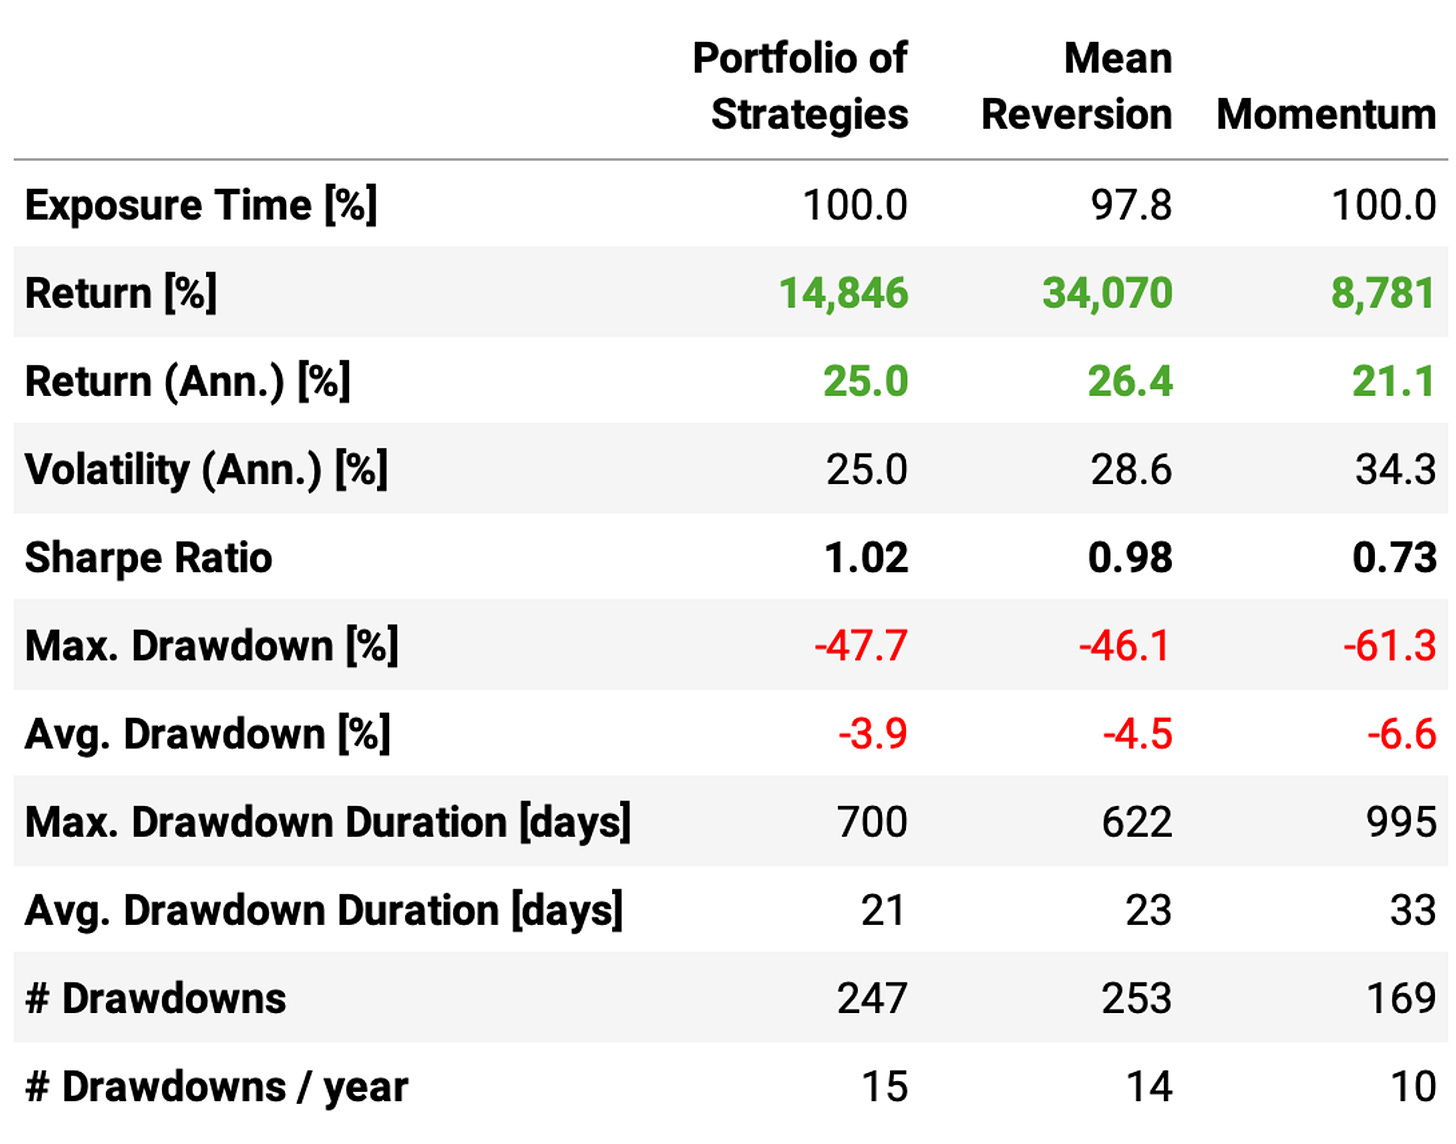
With this allocation, the Sharpe ratio would have increased to 1.02 (vs. 0.98 mean reversion and 0.73 momentum), and the maximum drawdown would have reduced to 37% (vs. 47% mean reversion and 61% momentum).
This improvement in risk-adjusted return would have cost us a few points in annual return: the portfolio of strategies would have achieved 23.7% annual return vs. 26.4% mean reversion and 21.1% momentum.
However, although we could fix these weights to forward-test, expecting the results of this backtest would not be reasonable (hence, I'm calling it naïve). Why?
Because it would have been impossible to know, at the beginning of the backtest, that the best weights were 75/25. How could we create a more robust optimization procedure, generating more real results we could expect looking forward?
A more robust optimization process
Here's a more robust optimization process:
At the beginning of every month, we will look back 10 years and find the allocation between both strategies that would have maximized the Sharpe ratio in the lookback period;
If there are not enough data points (less than 10 years of history), we will use all we have;
We will set these weights to each of the strategies and hold this allocation for 1 month;
At the beginning of the next month, we will repeat the process.
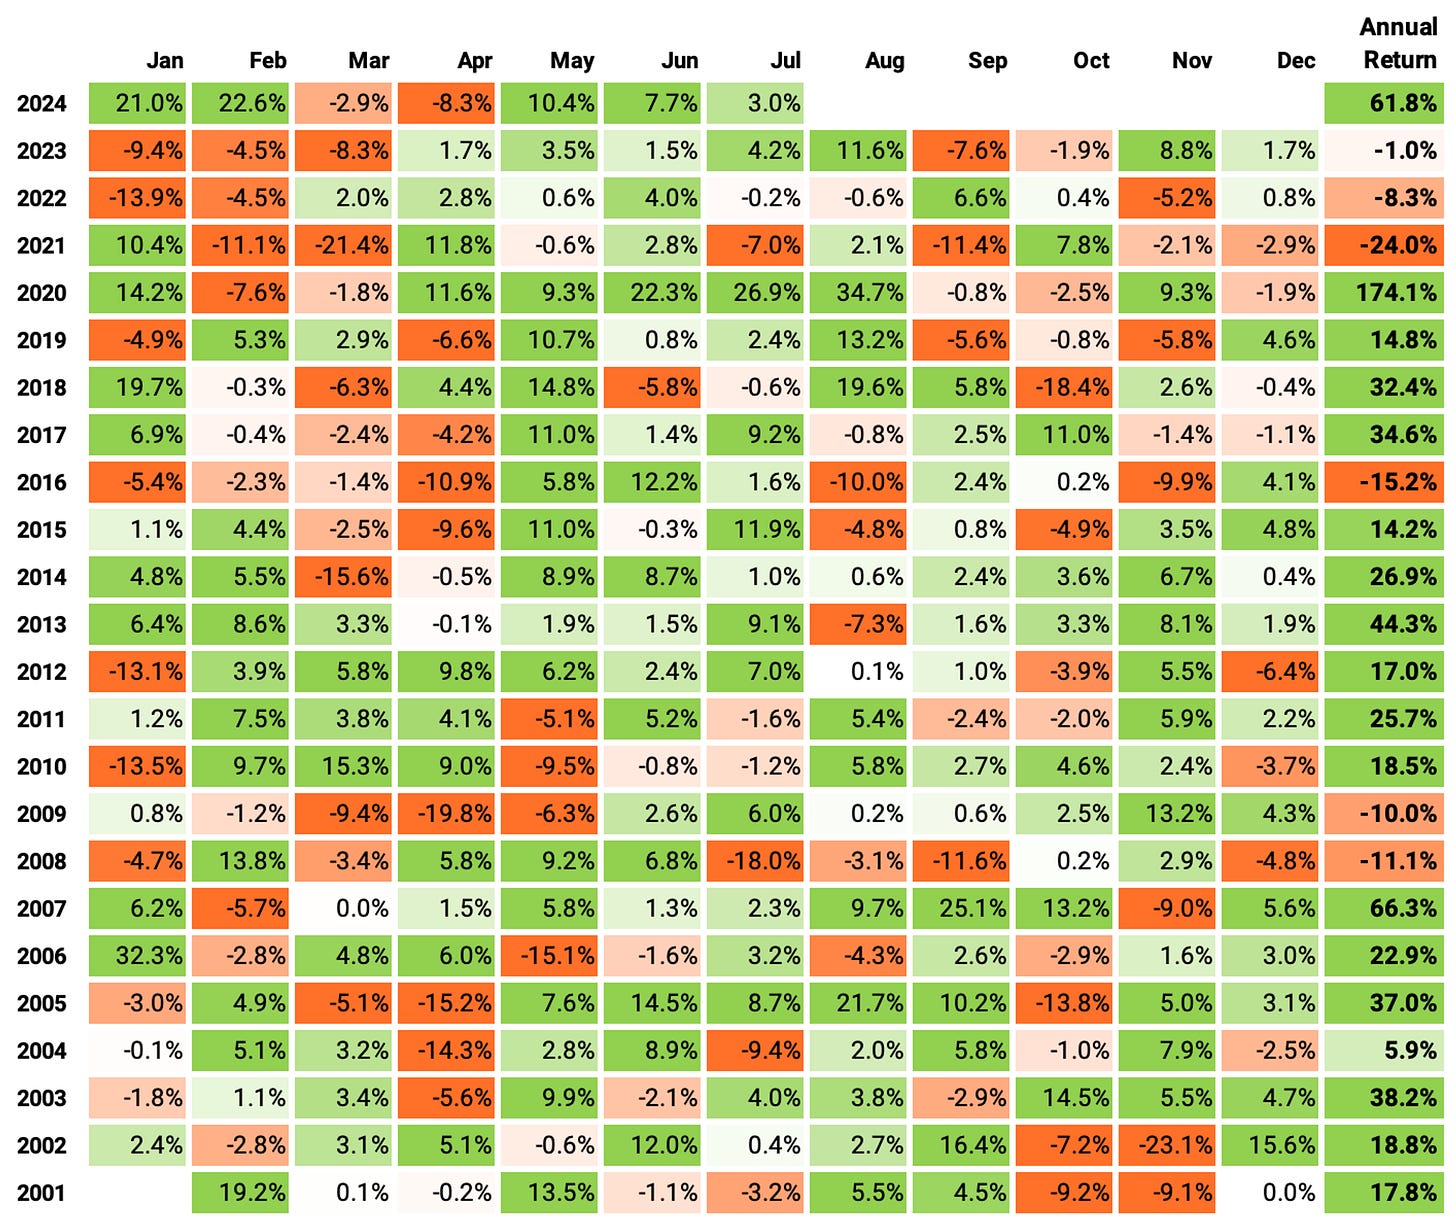
Here are the results of this process:

The highlights:
The portfolio of strategies achieves a 1.02 Sharpe, higher than both Sharpe ratios from the individual strategies;
The annual volatility reaches 25%, also better than both individual strategies at 28.6% and 34.3%;
The annual return is 25%, only 1.4ppt below the mean reversion strategy;
Although the maximum drawdown was not reduced in comparison to the mean reversion or the naïve optimization (47% vs. 46% and 37%, respectively), the drawdowns are shorter (21 days vs. 23 days in the mean reversion), and their average is lower (3.9% vs. 4.5% in the mean reversion);
The portfolio would have been profitable in 22 out of the 24 years;
It would have been profitable in 64% of the months;
The monthly mean return is 2.1%: 5.5% in positive months, -4.1% in negative months;
The best/worst months would have been Jan'06 (23.7%)/Nov'22 (-20.4%);
The longest positive streak would have been 12 months, from Mar'20 to Feb'21;
The longest negative streak would have been 5 months, from Dec'08 to Apr'09;
It's also interesting to observe how the portfolio was predominantly momentum until 2008-2009 and then shifted to being predominantly mean reversion from 2009 on.
Final thoughts
When I started this article, I was hoping to have achieved a portfolio of strategies with not only better risk-adjusted returns but also a lower maximum drawdown. However, although the portfolio reached a better Sharpe ratio, the maximum drawdown did not improve. Why?
I think there are two problems that need to be addressed:
First, the mean reversion strategy is much better than the momentum strategy. The momentum strategy does not contribute much, as we can see in the allocation evolution and in the naïve optimization (only 25% of weight using all the data). We need to improve the momentum strategy to get better results.
Second, both strategies are still positively correlated, with a 0.3 score. We could achieve much better results with scores closer to zero, even better if negative.
So, looking forward, let's try to find better momentum strategies and ensure it has an even lower correlation to the strong mean reversion strategy we already have.
Once we do that, we can revisit this 'portfolio-of-strategies’ idea. It is a promising concept.
As for what to test next week, I'm still undecided. There are many possibilities. If you have a suggestion, please let me know.
As usual, I'd love to hear your thoughts about this approach. If you have any questions or comments, just reach out via Twitter or email.
Also, if you want to implement this strategy (or any other strategy) and need help, just let me know.
Cheers!


hello, interesting strategy here. Assuming you're using python. Is that backtesting engine custom or some public library?
Interesting. Could you explain what you mean by the following, the formula?
"we sort them by volatility (Normalized Average True Range)"