Asset Embeddings
Turning portfolio co-holdings into alpha: a +2 Sharpe market-neutral strategy


The idea
“You shall know a word by the company it keeps.” John Rupert Firth.
John Rupert Firth was a British linguist and one of the pioneers of modern semantics. In the 1950s, he proposed a simple yet revolutionary idea: “You shall know a word by the company it keeps.” More than half a century later, this insight became the foundation for a breakthrough at Google, where Tomas Mikolov and his colleagues developed the Word2Vec model in 2013.
Before Word2Vec, computers treated words as isolated symbols—mere sequences of characters with no inherent meaning or relationship to one another. Mikolov’s model changed that. By mapping words into a continuous vector space, where proximity reflected contextual similarity, Word2Vec allowed machines to grasp meaning through relationships. The model revealed that linguistic structure could be learned directly from data. This marked a paradigm shift in how machines process language—from counting words to understanding them—and laid the foundation for today’s large language models and the broader AI revolution built on distributed representations and deep learning. (Not coincidentally, Ilya Sutskever, a co-author of the original Word2Vec papers, later became the co-founder and Chief Scientist of OpenAI.)
This week, we will investigate the paper Asset Embeddings by Xavier Gabaix (Harvard), Ralph S. J. Koijen (Chicago Booth), Robert Richmond (NYU Stern), and Motohiro Yogo (Princeton), published in April 2025.
After that, we will implement an original strategy to demonstrate the power of the authors’ idea. It’s a true paradigm shift.
Here’s our plan:
First, we will quickly summarize the paper
Then, we will demonstrate the power of asset embeddings with simple experiments
Next, we will create a trading strategy that uses asset embeddings and show its strong results
Finally, we will wrap up with final thoughts and next steps
Before we start, two messages.
First, the 2nd cohort of the course is still open for enrollment for the next couple of days.
I created this to respond to a request I’ve received from hundreds of readers here: access to my codebase, step by step — for those who want to develop strategies using the same approach I share here. Enrollment also includes access to the private community and an ever-growing library of study groups. More information at the link below.
Last day for enrollment in the 2nd cohort: Oct 14.
Second, this time it took me a bit longer than the usual 3–4 weeks to write and publish. There are a few reasons why:
First and foremost, I implemented three distinct papers, and their results came in significantly below what was reported. Instead of publishing subpar ideas, I prefer to keep searching for meaningful ones to share. That’s why I’ll never promise a rigid schedule — sometimes the search takes longer, but I’ll never compromise quality.
And, of course, just a lot of regular work :)
Welcome to all new subscribers — and rest assured: even if it sometimes takes a little longer than the usual 3–4 weeks to publish, the work continues non-stop.
Paper Summary
Core Idea
The paper introduces the concept of asset embeddings, inspired by advances in artificial intelligence such as Word2Vec and BERT. Instead of representing words by their co-occurrence in text, the authors represent assets by the portfolios that hold them.
Their central theoretical claim is that portfolio holdings contain all relevant information for asset pricing — far more than traditional firm characteristics (like book-to-market or profitability). In other words, the collective portfolio decisions of investors implicitly encode all the information used in the market to price assets.
Pause. Read that again. It is a bold paradigm shift. I loved it when I first read it a few months ago. I will repeat:
Portfolio holdings contain all relevant information for asset pricing — far more than traditional firm characteristics.
Methodology
The authors apply embedding models—recommender systems, Word2Vec-style shallow neural networks, and transformer architectures (BERT)—to financial data from 2005Q1 to 2022Q4.
Each firm and investor is represented as a point in a high-dimensional latent vector space, derived from institutional holdings data (13F filings, mutual funds, ETFs, hedge funds, etc.).
They also introduce investor embeddings, representing investors and their strategies in the same latent space.
Three empirical benchmarks test the usefulness of these embeddings:
Predicting relative valuations across firms.
Explaining stock return comovements.
Predicting institutional portfolio choices (the “masked portfolio” task).
Main Findings
Asset embeddings strongly outperform firm characteristics in predicting valuation, return comovement, and investor behavior.
A simple 4-dimensional embedding explains over 50% of the variation in relative valuations, compared to just 15% for standard firm characteristics.
Larger embeddings (e.g., 128 dimensions) explain over 70% of variation.
Transformer-based (BERT) embeddings achieve particularly high accuracy when predicting institutional portfolio decisions—showing that contextualized embeddings capture investor behavior far better than linear models or firm fundamentals.
Text-based embeddings (from OpenAI and Cohere) perform worse, as they reflect semantic similarity rather than investor-perceived relationships.
Interpretability
To interpret these latent embeddings, the authors use large language models (LLMs) (e.g., GPT-4) to analyze earnings-call transcripts of firms that appear close in embedding space. This allows the generation of economic narratives about why investors group certain firms together—shared risks, growth prospects, ESG features, etc.
Applications
The paper proposes wide-ranging uses:
Asset pricing and factor discovery: uncovering hidden dimensions of risk and return.
Generative portfolios: building synthetic portfolios (e.g., “COVID exposure”) without explicit return data.
Risk management and stress testing: simulating shocks by shifting embeddings.
Investor analytics: classifying investor styles, detecting crowded trades, and evaluating performance.
Conclusion
The authors argue that portfolio holdings are the most information-rich data source in finance, analogous to text corpora in NLP.
Just as word embeddings revolutionized natural language processing by revealing structure in unstructured data, asset embeddings may transform finance by revealing the latent structure of markets.
This bridges modern AI representation learning and asset pricing—potentially redefining how we understand, forecast, and manage financial markets.
The Power of Asset Embeddings
Before we jump into a trading strategy, let’s first see how powerful asset embeddings really are—much like word embeddings in NLP.
The paper explores several models, but here we’ll focus on Word2Vec. Libraries such as Gensim make it straightforward to implement.
Before that, we need data. In this exercise, we’ll use 13F filings from the Nasdaq Sharadar SF3 dataset, though many other data vendors can provide similar information.
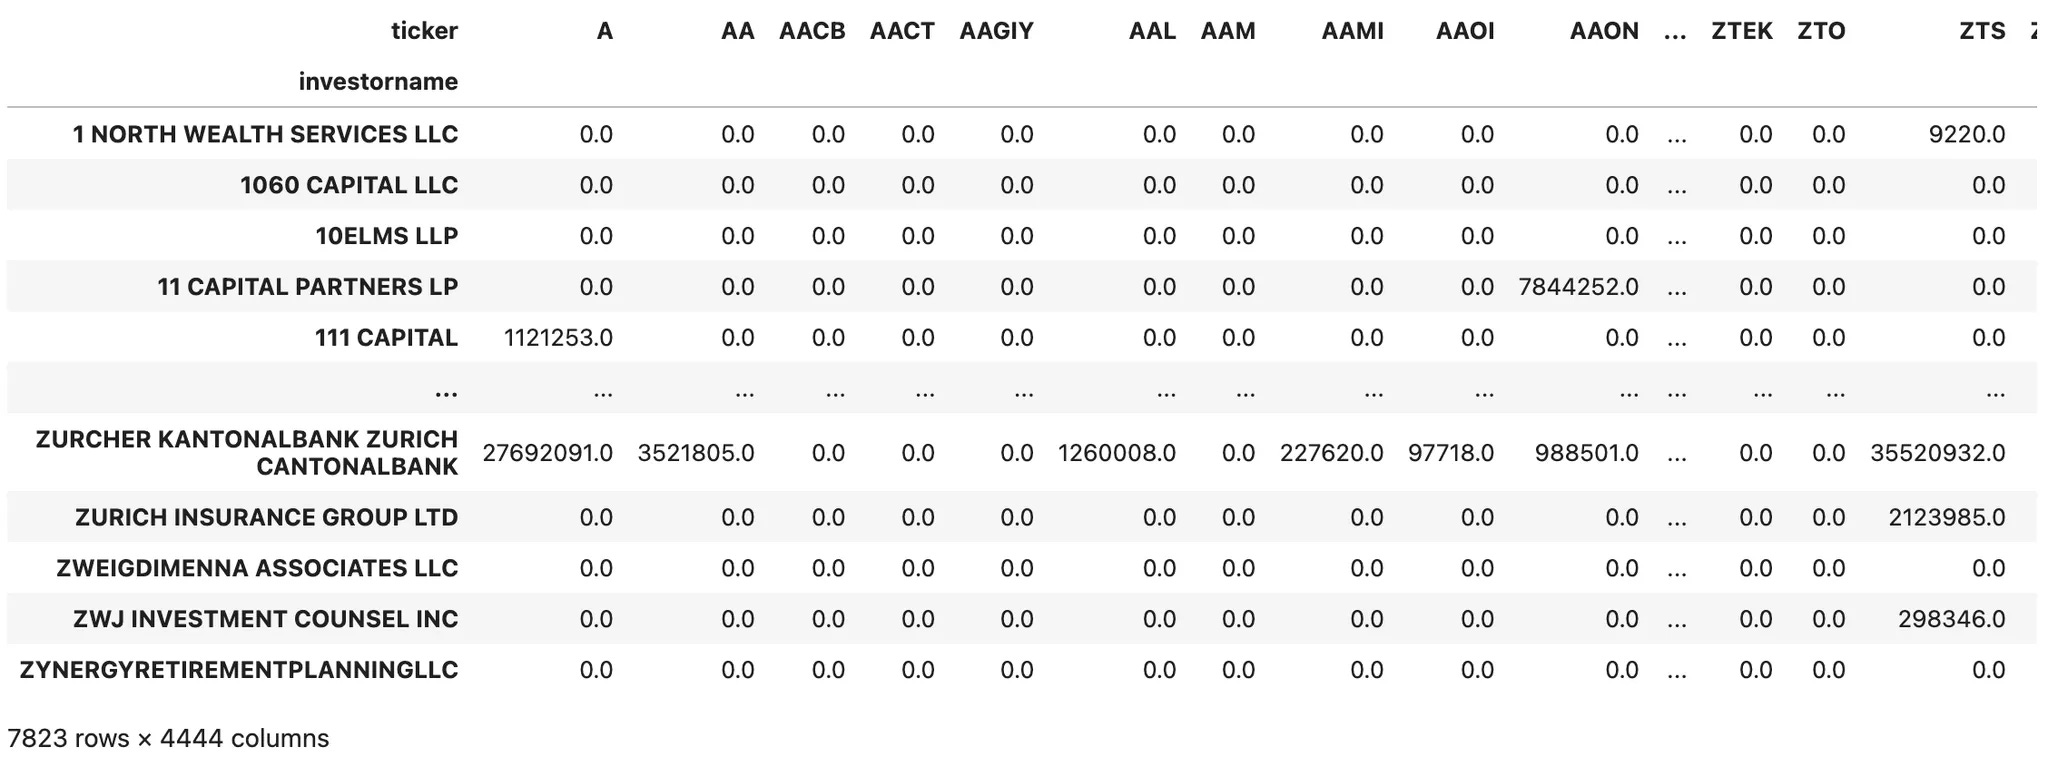
Our first step is to build a holdings matrix, with institutional investors as rows and assets as columns:
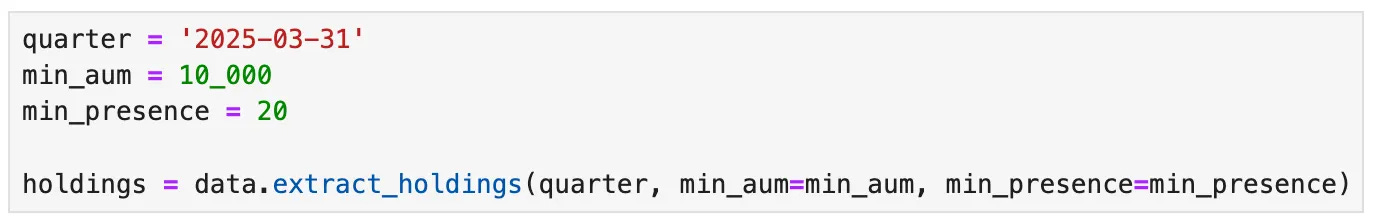
The extract_holdings method is a helper function that retrieves the holdings table described above, after applying the necessary filters. Institutional investors with less than $10 million in AUM are ignored, and stocks appearing in fewer than 20 portfolios are also excluded. The final result should look like this:
Now, let’s see how to train Word2Vec on institutional portfolios to generate asset embeddings based on co-holding relationships, as described in the paper:
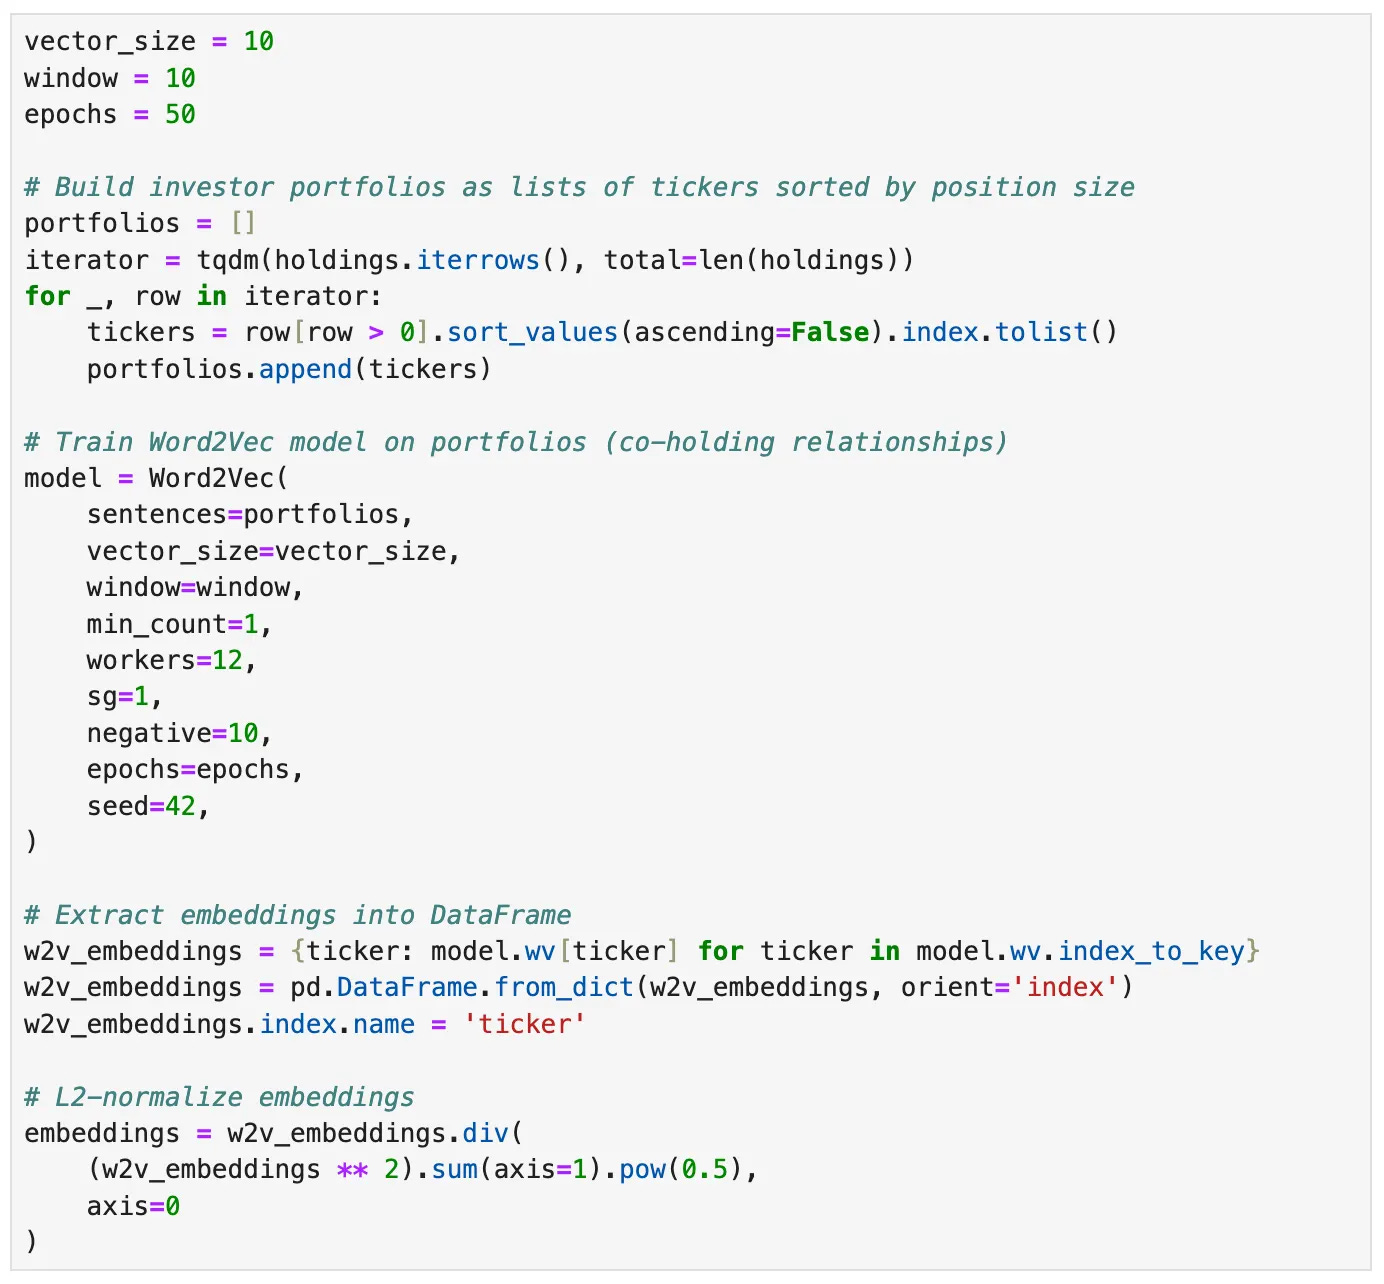
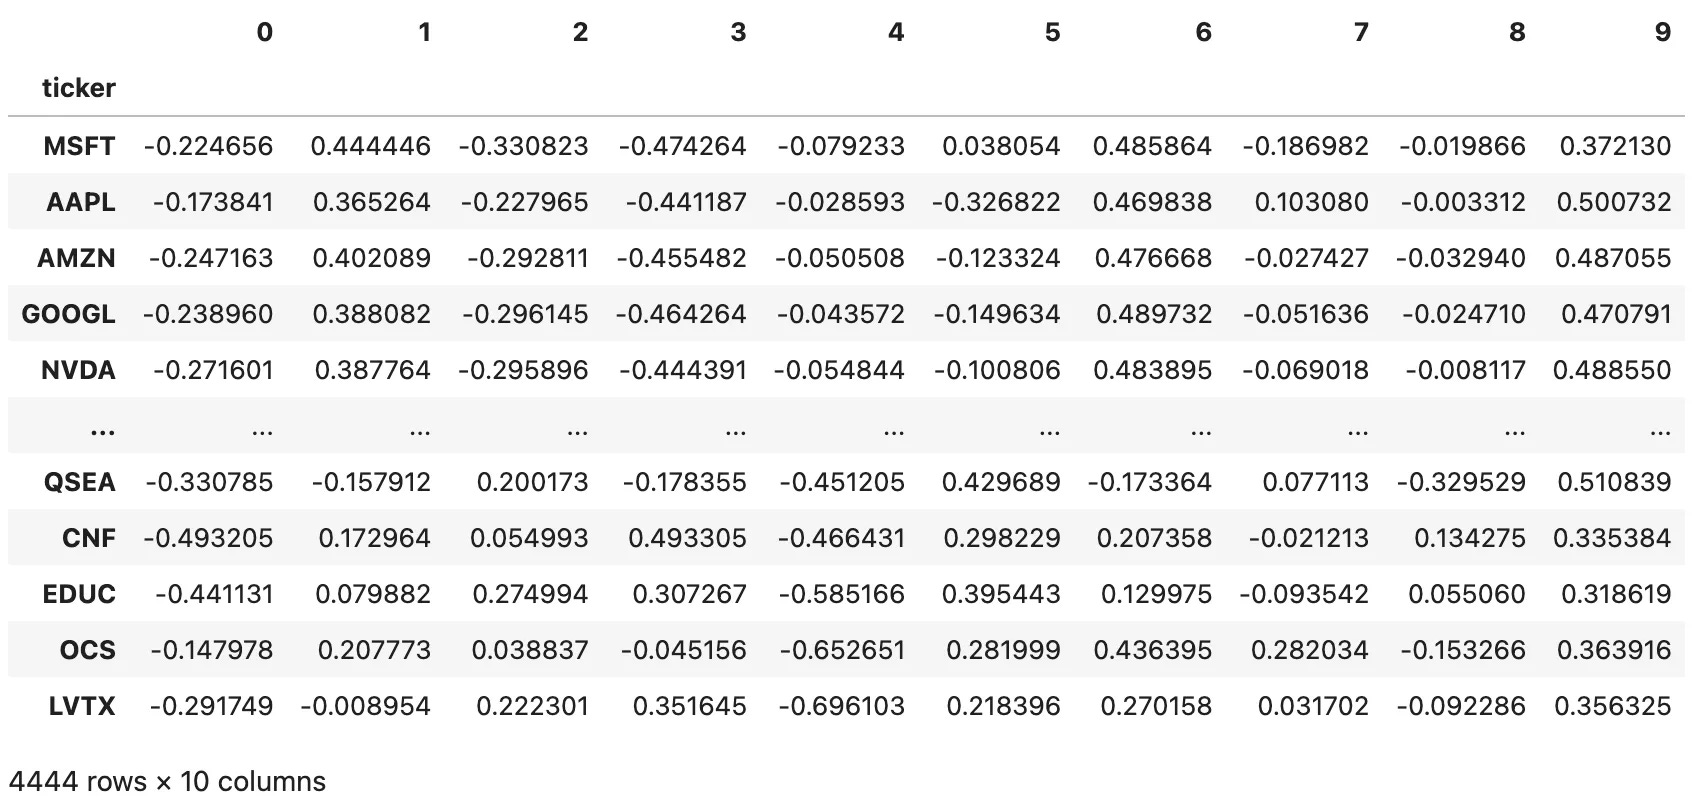
The code builds portfolios from the holdings, trains a Word2Vec model where each “sentence” is an investor’s portfolio, and then extracts and normalizes the resulting embedding vectors for each ticker. The final DataFrame embeddings contains the L2-normalized representation of every stock in the latent vector space:
That’s all there is to it. You can create clusters with just a few additional lines using Scikit-learn’s KMeans module or any other clustering method. Now, let’s see how powerful these representations really are with a few examples.
First Demo: Semantic Similarity
Let’s start by computing the top 10 most similar stocks to NU, using cosine similarity on the asset embeddings we just created:
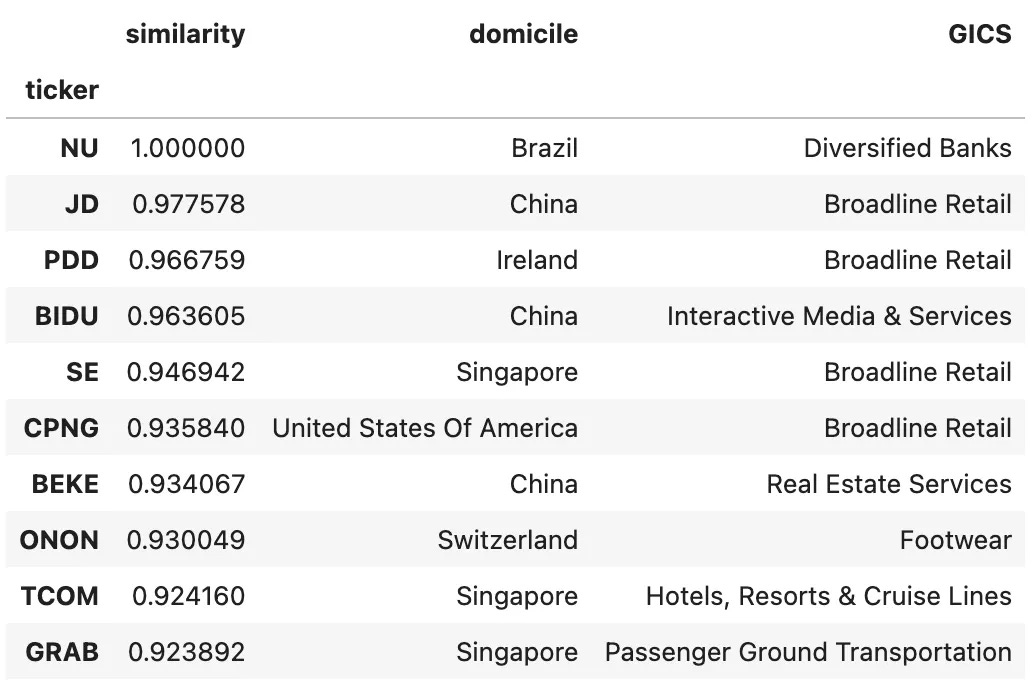
Even though the companies above come from completely different sectors, the cosine similarity in their embeddings reflects how institutional portfolios tend to group them together.
So, the similarity doesn’t come from fundamentals or business models, but from investor behavior.
Here’s a table summarizing what they have in common:
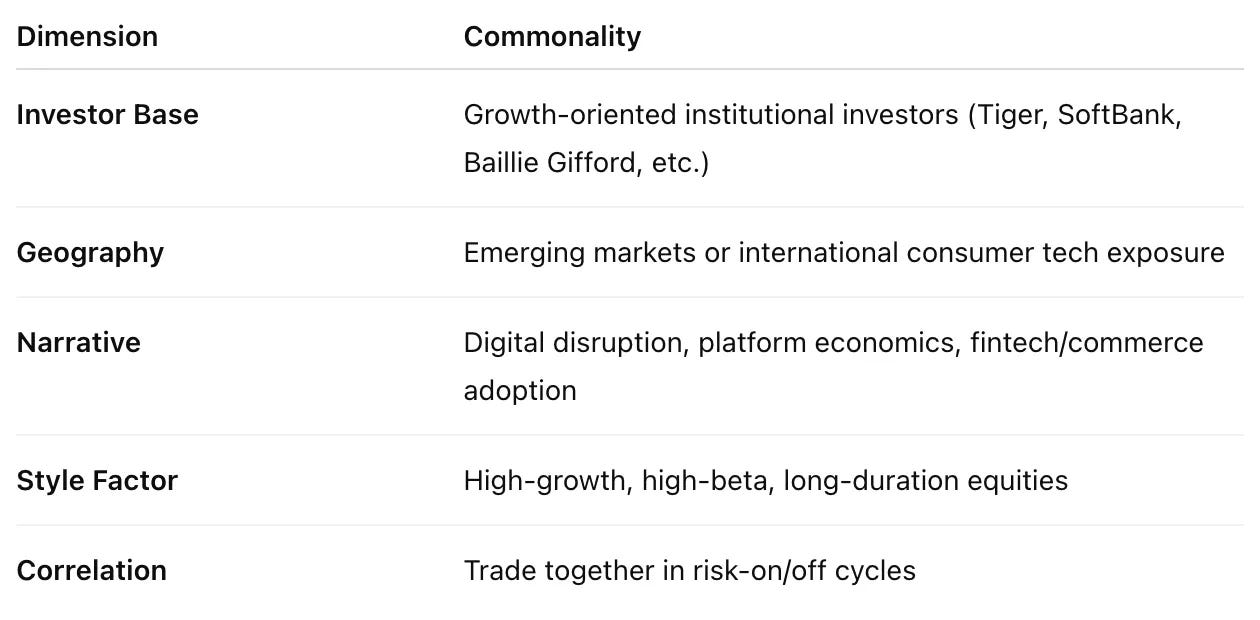
In short, these firms cluster not because they do the same thing, but because they are held by the same type of investors — global growth, EM tech, and crossover funds chasing the digitization theme.
And what’s really cool about it is that our model discovered this pattern from millions of 13F data points and just a few lines of code in a completely automatic process. Unsupervised machine learning at its best!
Second Demo: Vector Operations
If you ever find yourself in a computer science master’s or PhD program and decide to take an NLP class, I bet the first example you’ll see about Word2Vec will be the famous:
vector(”King”) − vector(”Man”) + vector(”Woman”) ≈ vector(”Queen”)
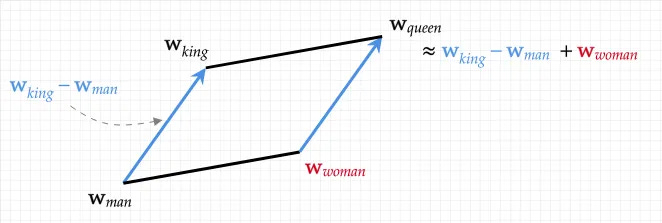
There’s a reason why they teach you this: that’s exactly the kind of demonstration that makes embeddings “click” for people. You see that the latent space encodes meaning, not just statistical co-occurrence.
Could we do the same for asset embeddings? You bet! Let’s try the following operation:
vector(”AMZN”) − vector(”WMT”) + vector(”BABA”) ≈ ?
Intuitively means:
“Take the concept of Amazon (a tech-driven online retailer), remove what makes it a traditional U.S. retailer (Walmart), and add what makes it Chinese (Alibaba).”
So we’d expect the resulting vector to point toward emerging-market e-commerce / digital consumer platforms — the BABA equivalents around the world. Here are the results:
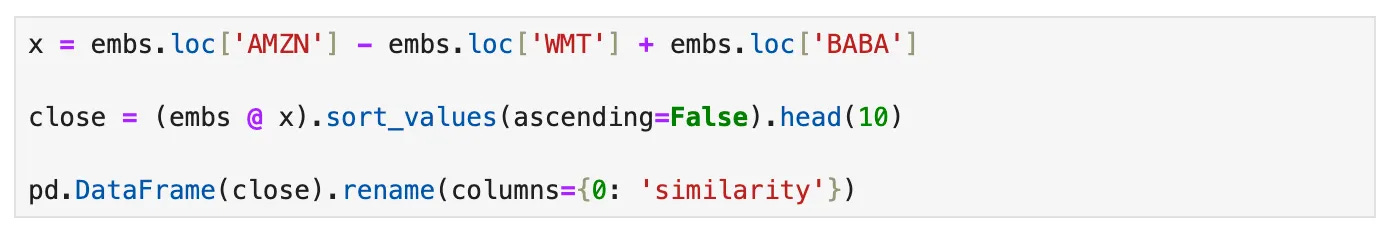

This embedding arithmetic perfectly captured the latent theme:
“Tech-driven consumer platforms in emerging markets.”
We basically told the embedding:
“Find me the Amazon equivalent, but outside the U.S., in markets like China.”
And it delivered:
China → PDD, JD, BABA, TCOM, YMM
Southeast Asia → SE
Latin America → MELI, NU
India → IBN
That’s remarkably structured.
Even the slight outlier (CCJ) likely reflects shared institutional exposure through EM ETFs or crossover funds with a macro “growth + commodity exposure” tilt.
Alright… but how can we turn this into a profitable trading strategy? Let’s look at an example next.
A Strategy Example
Let’s review a strategy that demonstrates the power of this paradigm shift, using asset embeddings. The goal is to illustrate just one of many ways asset embeddings can be applied to build innovative systematic strategies.
I know some institutions may want to take this further and need help doing so. In that case, feel free to reach out at cs@quantitativo.com.
Important considerations
First, some important notes to keep in mind before devising a strategy:
Asset embeddings are learned from 13F data, which is released with a 45-day delay. For example:
Embeddings from Q4’24 can be extracted and used from ~Feb 15 to May 15, 2025.
Embeddings from Q1’25 can be extracted and used from ~May 15 to Aug 15, 2025.
Embeddings from Q2’25 can be extracted and used from ~Aug 15 to Nov 15, 2025.
And so on.
As such, any idea that aims to use asset embeddings to directly predict short-term price movements will likely not work, because we are always working with the previous quarter’s embeddings (which do change from quarter to quarter) and with a 45-day delay.
Nevertheless, any idea that profits from using asset embeddings to cluster assets and find inefficiencies within those clusters is more likely to work, because institutional portfolio structures and co-holding patterns tend to evolve slowly over time, making intra-cluster relationships relatively persistent.
The paper explores both linear (PCA) and nonlinear (Word2Vec, BERT, etc.) asset embeddings. I personally tested PCA and Word2Vec (which is a shallow neural network), and here’s what I found:
Word2Vec yields superior results.
However, this comes with a drawback: the coordinate system of the multidimensional vector space is not stable — it changes from quarter to quarter. For instance, imagine you trained Word2Vec models with 10 dimensions. Dimension 3 in Q1’25 is not directly comparable to Dimension 3 in Q2’25.
We can use ML techniques to align or stabilize coordinate systems for linear models like PCA, but not for nonlinear embeddings.
As such, this rules out any strategy that depends on inter-quarter relationships between nonlinear embeddings. For linear embeddings, however, that’s feasible.
Ok, Carlos… but what does all this mean in practice?
It means that ideas based on finding inefficiencies within groups are likely to work very well. You know all those strategies that use industries, sectors (or even pairs) to identify relative-value opportunities and trade them?
Those kinds of ideas.
Idea
We define a trading period as the ~90 days from the middle of one quarter to the middle of the next. For example:
Feb 15 to May 15, 2025 → uses embeddings from Q4’24
May 15 to Aug 15, 2025 → uses embeddings from Q1’25
At the beginning of each trading period:
Use asset embeddings to cluster all assets into 50 groups.
Select the top 10 groups based on predictive power (*).
Each day, form long–short portfolios within each group using the volatility-adjusted residuals of daily returns relative to the return of the cluster (using quintiles).
Rebalance daily.
(*) How are the top 10 groups selected? We assess predictive power by running an OLS regression where each group’s residuals serve as predictors of next-day returns, using the current clusters and the previous quarter’s returns. We then rank the groups by their t-statistics and select the top 10.
Friction Assumptions:
Commissions / Costs: $0.0010 per share in trading costs.
Shorts: Since the backtest starts in 2020, we have access to short-availability data. The model assumes that only stocks with sufficient borrow availability were shorted.
I think that’s good enough to illustrate the power of asset embeddings in a simple strategy. Let’s see the results:
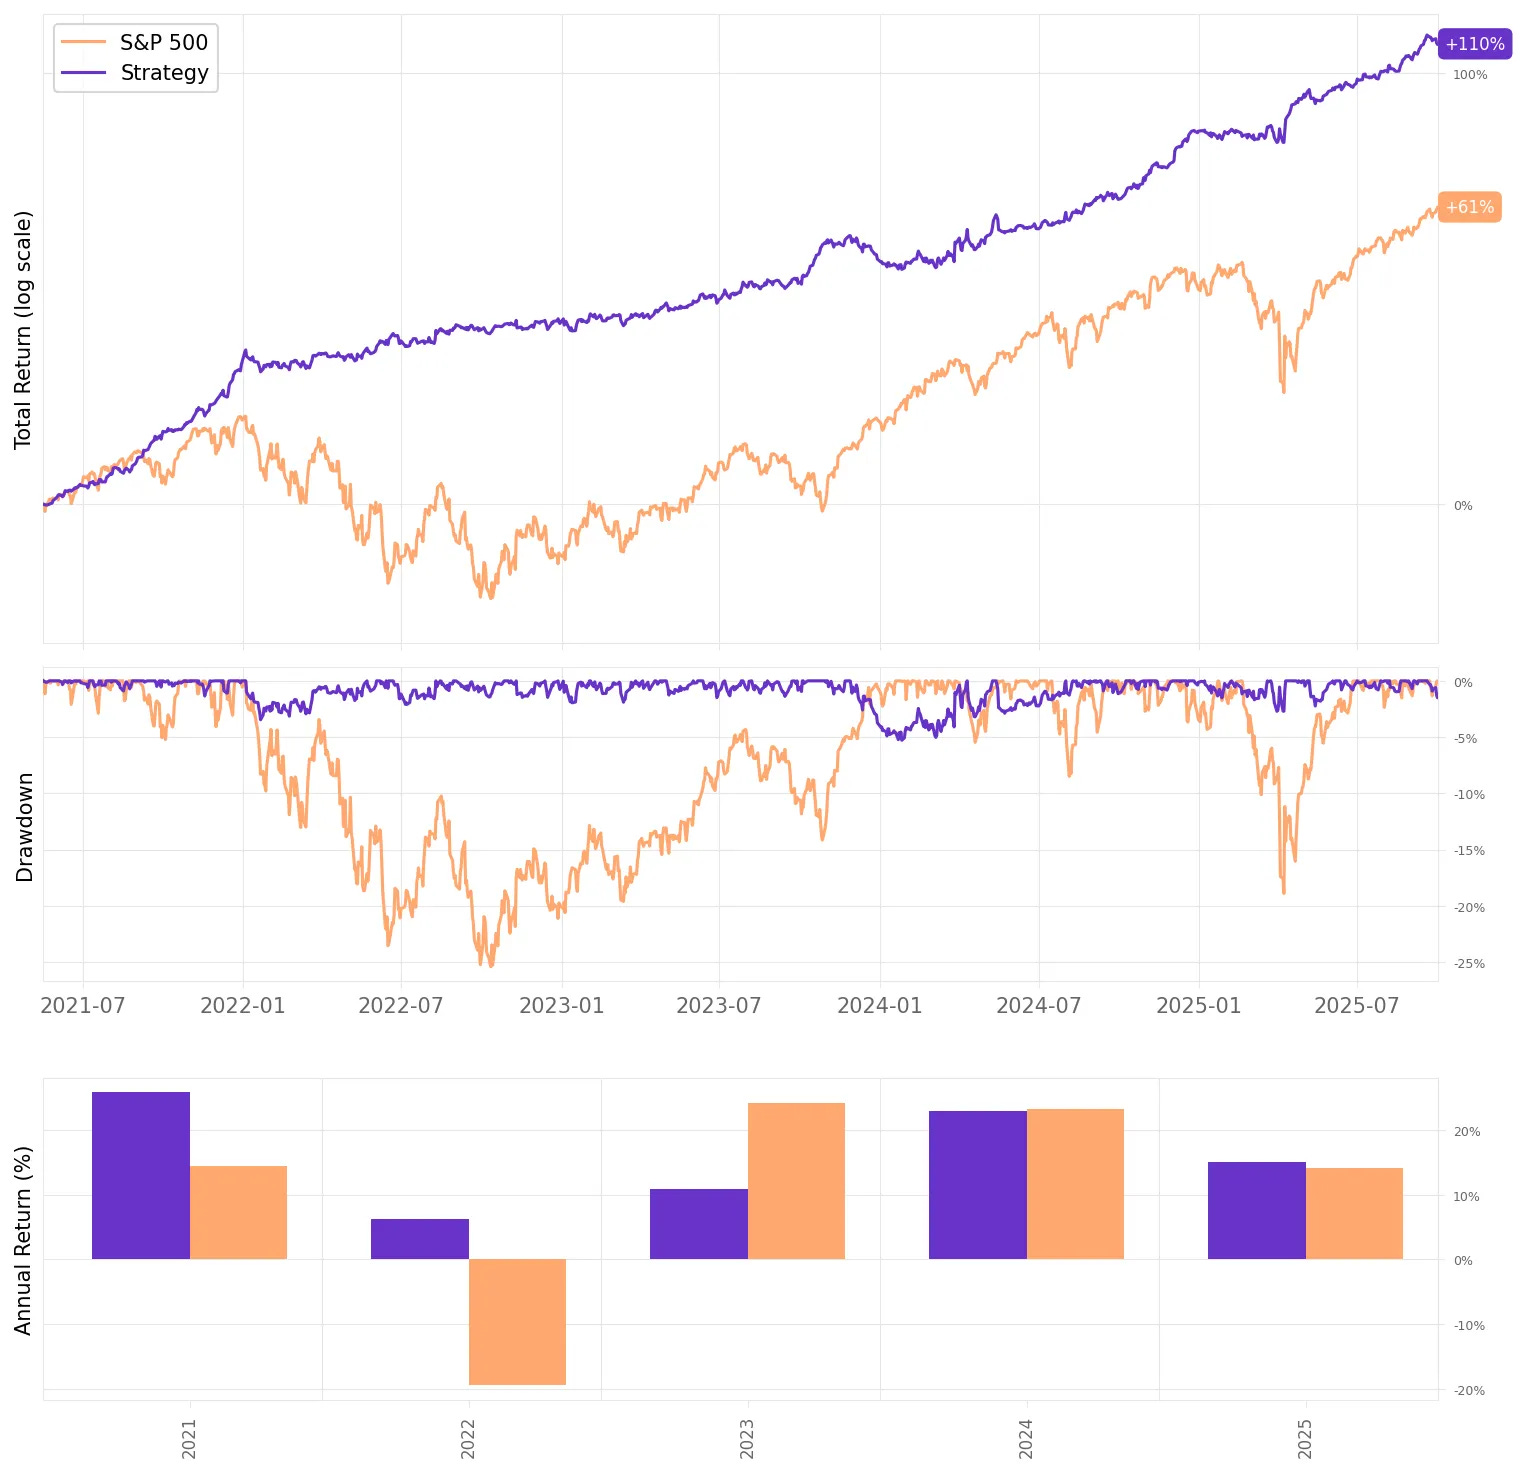
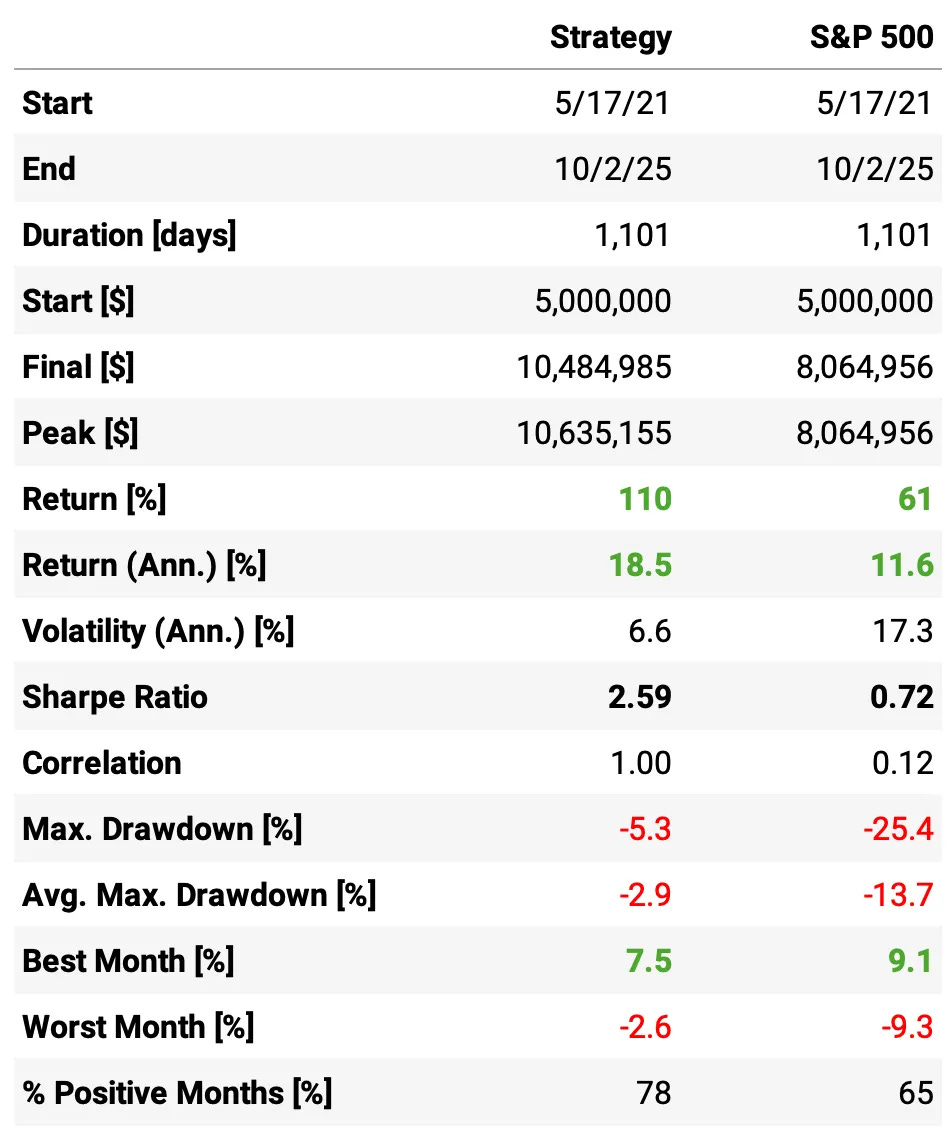
The results are not bad at all:
Annualized return is 18.5%, almost 2x the S&P 500;
Sharpe Ratio is 2.59, nearly 4x higher than the benchmark’s 0.72;
Volatility comes in at 6.6%, almost 1/3 of the S&P 500;
Maximum drawdown is -5.3%, considerably smaller than the S&P 500’s -25.4%;
Correlation to the S&P 500 is effectively zero, offering diversification benefits;
The strategy also delivered 78% positive months, with a worst month of only -2.6% — versus the benchmark’s -9.3%.
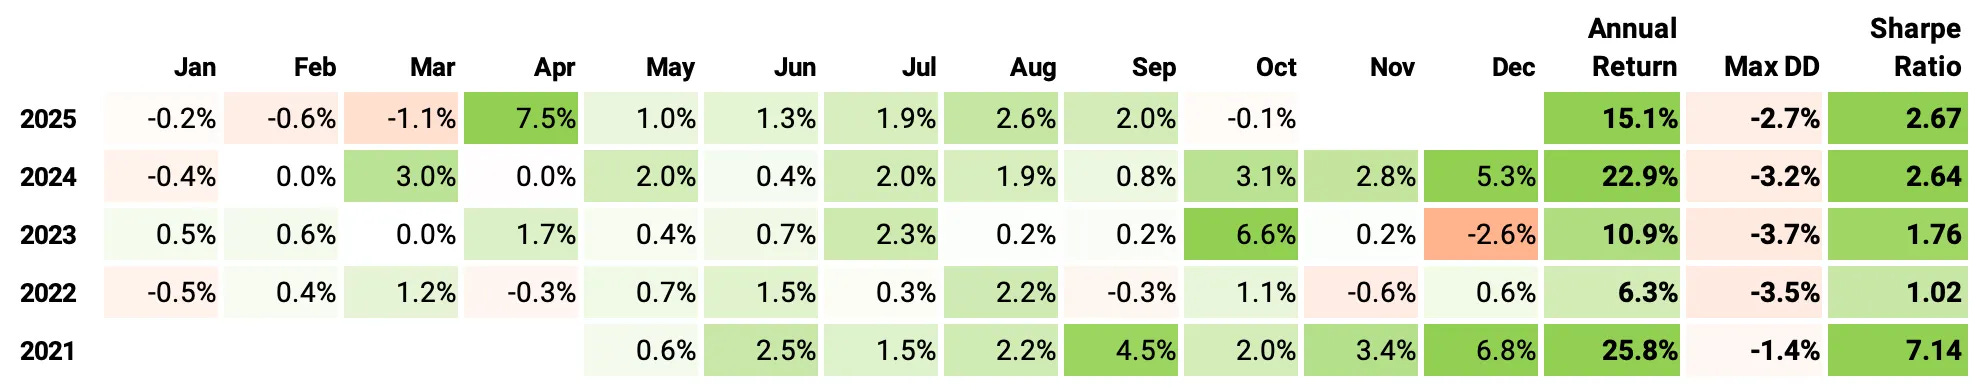
If we had traded this strategy since 2021:
We would have had only positive years;
We would have seen 78% of the months positive, with the best at +7.5% (Apr’25);
We would have seen 22% of the months negative, with the worst at -2.6% (Dec’23);
The longest positive streak would have been 12 months, from Dec’22 to Nov’23;
The longest negative streak would have been 3 months, from Jan’25 to Mar’25.
Looking at Fama-French 3-Factor risk model:
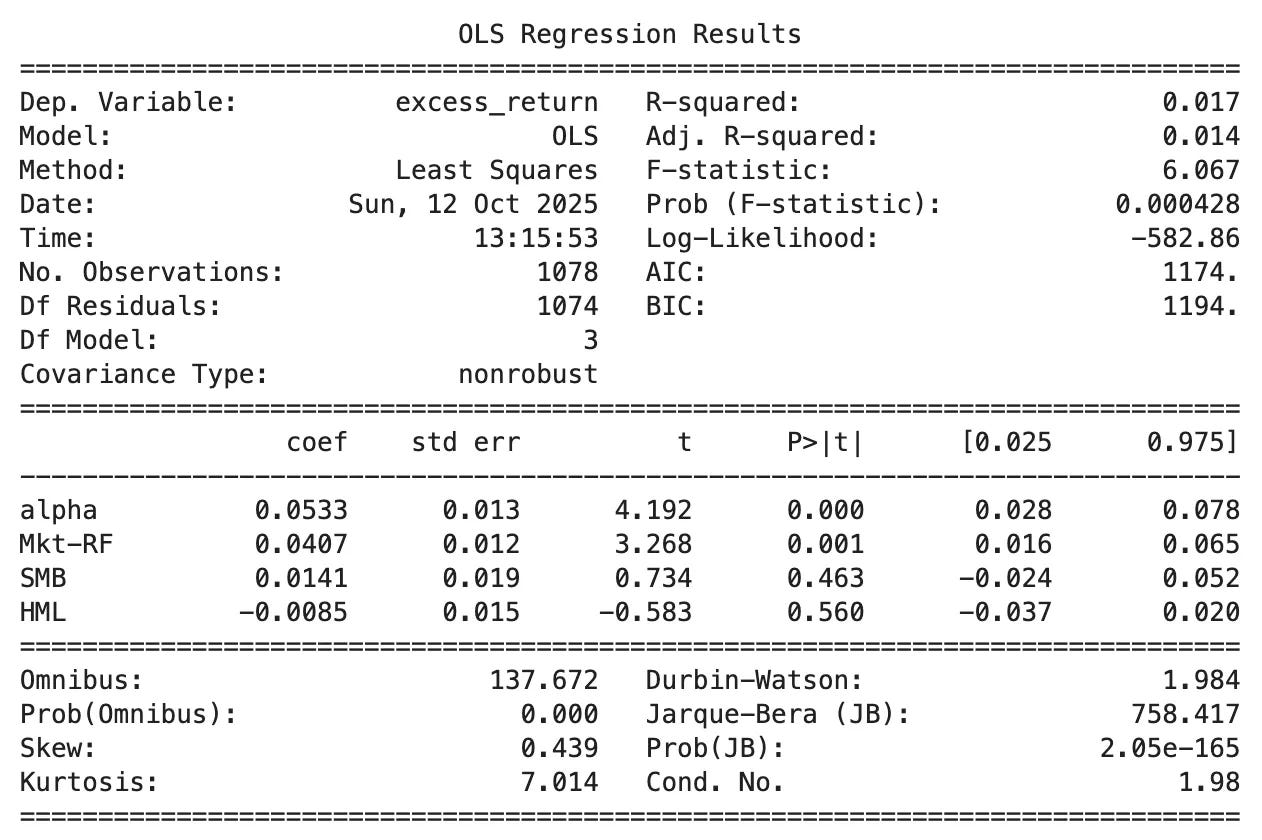
Alpha: 0.0533% per day → annualized ≈ 14%, highly significant (t = 4.19, p < 0.001) — the strategy delivers strong abnormal returns not explained by standard risk factors.
Market Beta (Mkt–RF): 0.041 → very low market exposure (t = 3.27, p = 0.001) — the strategy’s returns are largely independent from overall market movements.
SMB (Size): 0.014, insignificant (t = 0.73, p = 0.46) — no systematic bias toward small or large caps.
HML (Value): –0.009, insignificant (t = –0.58, p = 0.56) — no clear tilt between value and growth stocks.
R² = 0.017 → only 1.7% of return variation explained — factor exposures are minimal; performance is almost entirely idiosyncratic.
This is what we want from a market-neutral strategy.
Final Thoughts
What we’ve seen here is not just another backtest or statistical curiosity — it’s a glimpse of the power of asset embeddings.
By reframing how we represent assets—not through accounting ratios or static fundamentals, but through the collective behavior of investors—we move closer to a model of markets that actually mirrors reality: adaptive, relational, and dynamic.
In essence, asset embeddings turn holdings into language. Each portfolio is a “sentence,” each stock a “word,” and meaning emerges from co-occurrence. From that simple shift, an entire new toolkit becomes available: clustering, similarity search, latent factor extraction, and—eventually—prediction.
Our strategy example only scratches the surface. It shows that embeddings can generate robust, market-neutral alpha, even with basic clustering and residual sorting. But the real potential lies beyond this first layer:
Dynamic embeddings: tracking how relationships between assets evolve over time;
Cross-domain embeddings: combining holdings, news, and price data into shared representations;
Generative portfolios: constructing exposure to abstract concepts (“AI boom,” “energy transition”) directly from latent space.
Finance has always been about representation — how we compress the complexity of the world into variables we can reason about. Moving from firm characteristics to embeddings doesn’t replace traditional approaches, but adds a new layer of understanding — one that captures relationships, context, and behavior directly from the data. It’s an early step toward a richer, more relational way of modeling markets. And we’re just getting started.
As always, I’d love to hear your thoughts. Feel free to reach out via Twitter or email if you have questions, ideas, or feedback.
Cheers!
The 2nd cohort of the course is still open for enrollment for the next couple of days.
I created this to respond to a request I’ve received from hundreds of readers here: access to my codebase, step by step — for those who want to develop strategies using the same approach I share here. Enrollment also includes access to the private community and an ever-growing library of study groups. More information at the link below.
Last day for enrollment in the 2nd cohort: Oct 14.
Excellent work, Quantitativo. Your analysis is consistently sharp and engaging, and this strategy shows real promise!
Cool! Seems the hardest part would be data handling at first