More Bets, Better Bets
Expanding a 1.30 Sharpe strategy from the S&P 500 to the Russell 3000

The idea
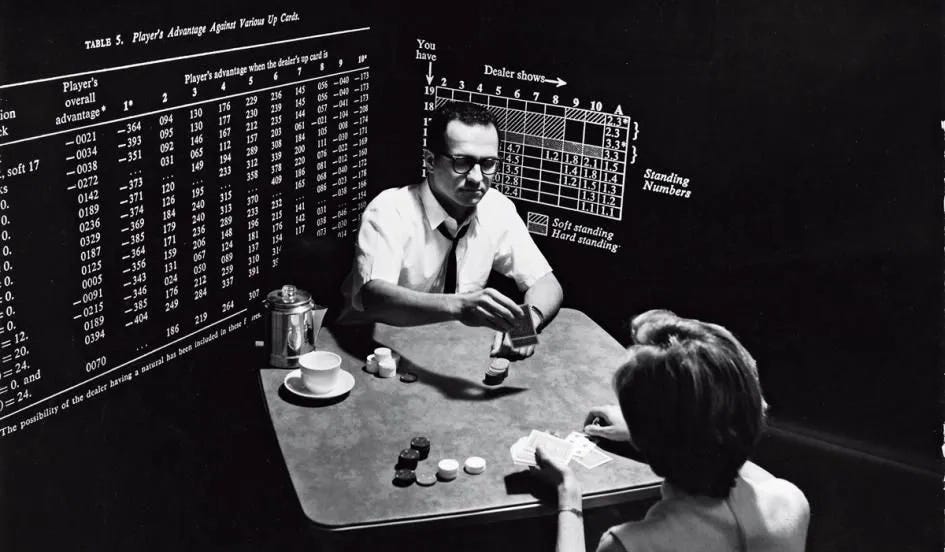
“Casino gambling with a system where you have the edge is a wonderful teacher for elementary money management.” Ed Thorp
Ed Thorp is the money manager I admire most. Many people have never heard of him. They should have. In 1961, with Claude Shannon — the father of information theory — he built the first wearable computer to beat roulette. He wrote Beat the Dealer and proved blackjack could be conquered with math. He derived the Black-Scholes options pricing formula years before Black and Scholes — but chose to trade on it instead of publishing. Then he founded the world’s first quant hedge fund, posting 227 winning months out of 230. Finally, as he decided to end his famous hedge fund, he passed some of his learnings to the young Ken Griffin and became Citadel’s first LP. And it all started at the blackjack table.
Casinos don’t gamble. They have an edge on every game, they let everyone play, and they let the math do the rest. Over thousands of bets, the law of large numbers turns a small edge into a certainty. Thorp saw this and turned it against them. Then he took the same logic to Wall Street.
The lesson is simple. If you have a proven edge, you don’t want bigger bets. You want more bets.
This week, we take a proven mean reversion strategy — the one from Murphy’s Law — and expand it from the S&P 500 to the Russell 3000. More stocks. More signals. More bets. The challenge: doing it without diluting the edge. Here’s the plan:
The trap: why expanding your universe naively destroys the edge
The filter: dynamically avoiding names with high blow-up risk
The test: Does it actually work?
The takeaway: final thoughts and next steps
Let’s get started.
Course and Community: enrollments Open
As many of you requested, the 3rd cohort of the course is now live and open for enrollment.
It walks through my codebase step by step and is designed for readers who want to develop quant strategies using the same approach I’ve shared here.
You’ll find all the details—content, structure, pricing, and FAQs—at the link below. If you have any questions, feel free to reach out.

Enrollment also includes access to the private community and an ever-growing library of study groups.
The trap of more
Our baseline is a mean reversion strategy on S&P 500 stocks. When a name drops more than its own history says it should, we buy. When it snaps back, we sell. Simple entry, simple exit, solid edge — a +1.2 Sharpe with only one down year in twenty-two. For the full breakdown, check the original article: Murphy’s Law.
Here’s what happens when we naively apply the same idea to the Russell 3000:
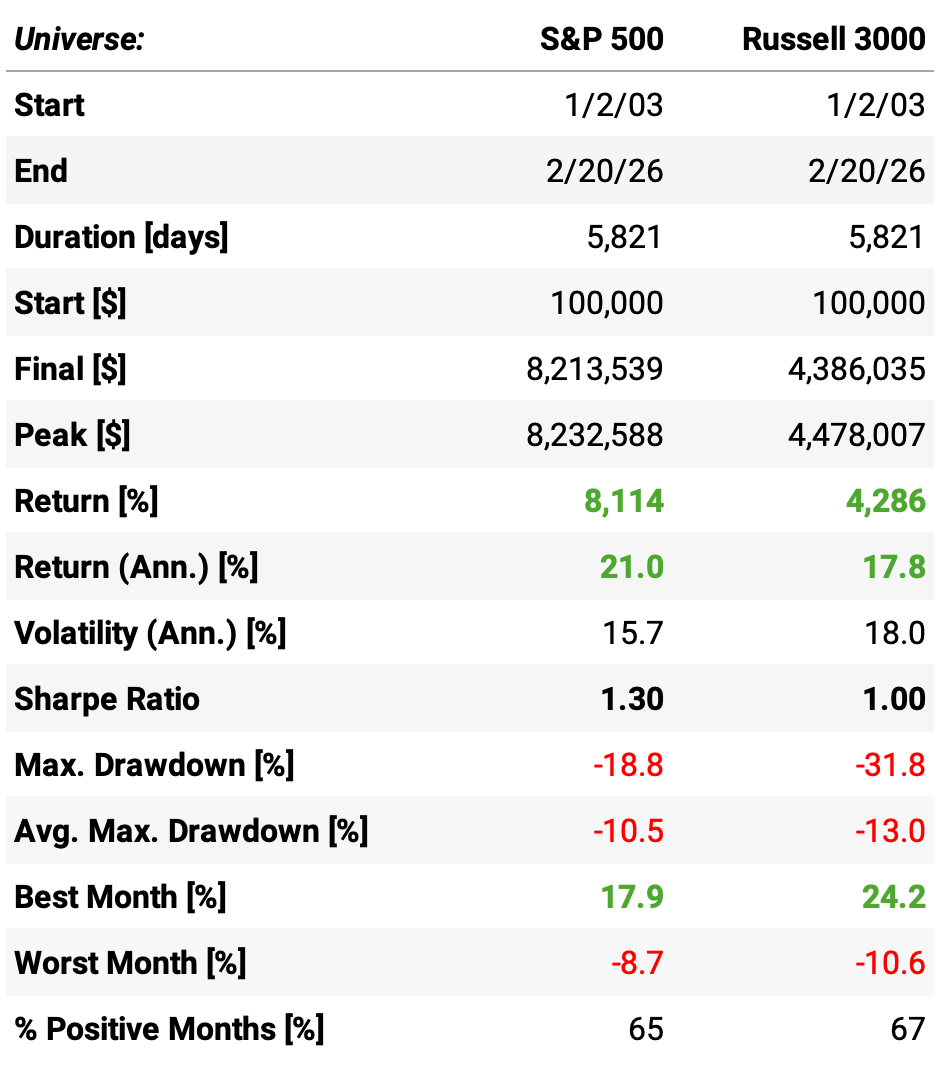
The Russell 3000 is roughly 6x larger, so we scale accordingly: 60 maximum positions instead of 10. More bets, right? Yes — but worse ones:
Total return cut nearly in half: 4,286% vs. 8,114%
Sharpe ratio dropped from 1.30 to 1.00
Max drawdown nearly doubled: -31.8% vs. -18.8%
Same signal, different risk
The signal is the same. The entry logic is the same. The exit is the same. The only thing that changed is the universe. So where did the edge go?
Our hypothesis: the edge didn’t disappear. It got noisier. The Russell 3000 includes thousands of smaller, less liquid names. These stocks may mean-revert just as often, but when they don’t, they blow up harder. If that’s true, the problem isn’t signal quality — it’s tail risk. And if it’s tail risk, we can filter it out.
To test this, we compare the trade-level statistics of both universes side by side — and look specifically at three tail-risk metrics, computed on a rolling basis. At the moment a trade is triggered, the stock already carries these numbers — they describe the name as it enters the position:
Skewness measures the asymmetry of the return distribution. Negative skew means the left tail is fatter — losses are larger and more frequent than gains. A stock that mean-reverts cleanly should have positive or near-zero skew.
Semivariance ratio is the share of total variance that comes from below-zero returns. A ratio above 0.5 means most of the volatility lives on the downside. The higher the ratio, the more the risk is concentrated where it hurts.
CVaR 5% (Conditional Value at Risk) is the average return in the worst 5% of trades. VaR tells you the door to the left tail. CVaR tells you what’s behind it.
Let’s see the numbers:
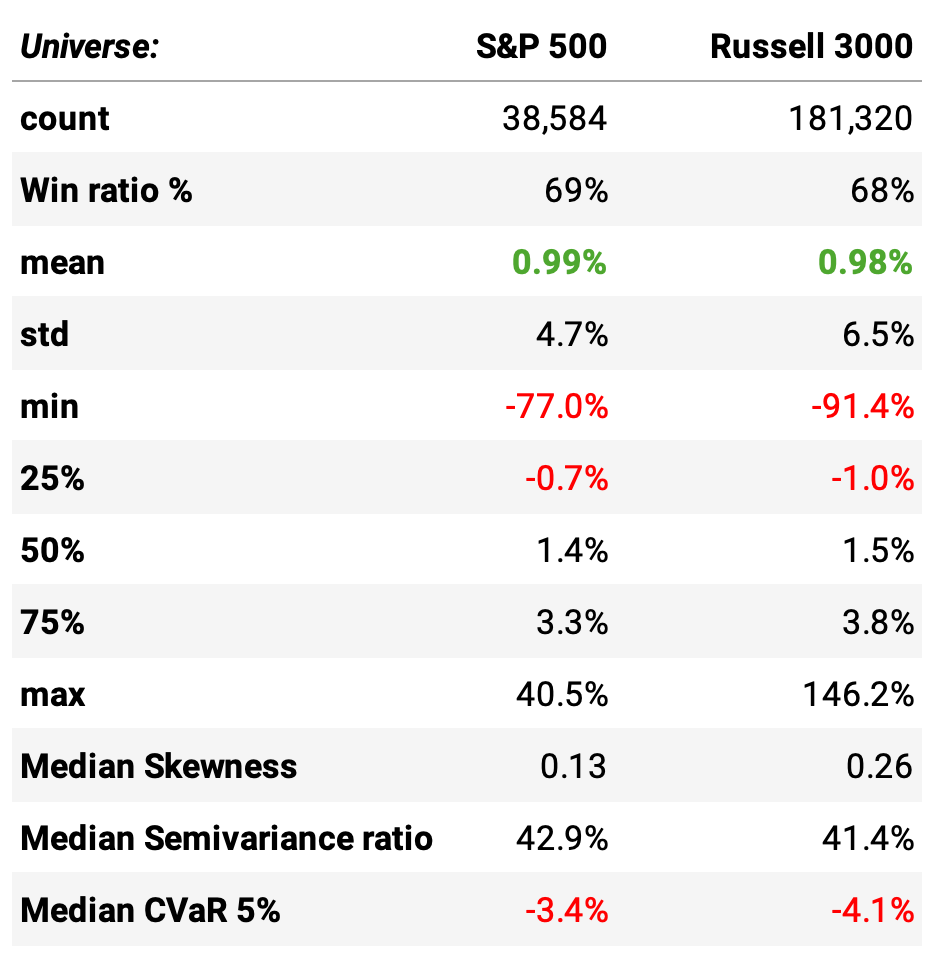
The edge is almost identical. Mean return per trade: 0.99% vs 0.98%. Win rate: 69% vs 68%. Median trade: 1.4% vs 1.5%. If you stopped here, you’d think expanding the universe is free money. It isn’t. Look at the risk:
Volatility per trade jumps 37%: 6.5% vs 4.7%. Same average, much wider dispersion.
The worst trade gets worse: -91.4% vs -77.0%. The left tail extends further.
CVaR 5% widens: -4.1% vs -3.4%. When things go wrong, they go more wrong.
The right tail explodes too: max winner goes from +40.5% to +146.2%. These aren’t clean mean-reversion trades. They’re lottery tickets — and lotteries have losers.
Interestingly, the median skewness and semivariance ratio are actually better in the Russell 3000. The typical name is fine. The problem isn’t the typical name.
The conclusion is clear. The signal works just as well in the broader universe. The edge per trade is virtually unchanged. But the distribution around that edge is far wilder — and in a portfolio of 60 positions, it only takes a few blow-ups to wreck the month. The fix isn’t a better signal. It’s a better filter. We need to identify the dangerous names before we enter the trade — and stay away.
Same signal, safer bets
We know the edge survives in the Russell 3000. We also know the tails are wider and more dangerous. The fix sounds simple: don’t trade names with ugly tails.
Here’s what we do. Before entering any trade, we check the stock’s rolling CVaR 5%. If the left tail is too deep, we skip it. The signal might be screaming “buy.” We don’t care. A good entry into a bad name is still a bad trade.
But filtering alone isn’t enough.
The Russell 3000 has roughly 3,000 names. Even after removing the dangerous ones, hundreds of signals fire at any given time. Taking all of them — 60 positions, like before — means diluting the portfolio into mediocre setups. The best signals get the same weight as the barely-passing ones. That’s not “more bets.” That’s more noise.
The filter tells us who not to trade. The position cap tells us how selective to be. We want both. So we filter first, then concentrate: 15 positions, drawn only from names that pass the tail-risk screen.
Let’s see what this does. Below we compare the Russell 3000 strategy with 15 positions — without and with the CVaR filter (6% threshold):
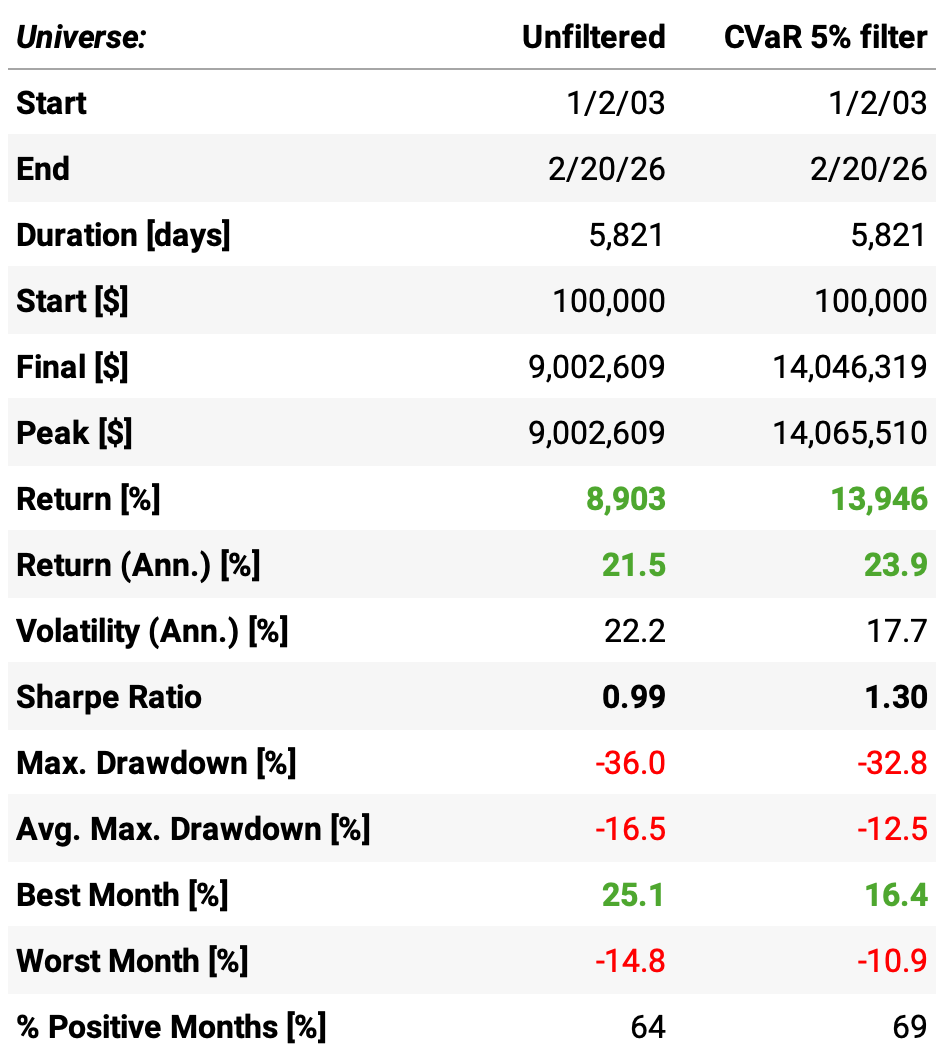
The filter works. Across the board:
Total return jumps 57%: 13,946% vs 8,903%. Same universe, same signal, same number of positions. The only difference is which names we avoid.
Sharpe ratio leaps from 0.99 to 1.30: not by increasing return alone, but by crushing volatility — from 22.2% down to 17.7%.
Max drawdown improves: -32.8% vs -36.0%. The worst month shrinks from -14.8% to -10.9%.
Best month gets smaller too: 16.4% vs 25.1%. That’s a feature, not a bug. Those +25% months were the flip side of the fat tails we just removed.
More positive months: 69% vs 64%. The strategy wins more often when it stops stepping on landmines.
The story is simple. We didn’t change the signal. We didn’t change the entry or the exit. We just asked one question before every trade: does this name have a history of blowing up? If yes, we walk away. That single filter turned a mediocre strategy into one that rivals our S&P 500 baseline — with a 1.30 Sharpe on a completely different universe.
Which raises an obvious question. What happens when we stop choosing between the two — and combine them?
More bets, better bets
We started with a question: can we trade more without trading worse? The answer is yes — but only if we’re selective. We take our S&P 500 baseline — 10 positions, proven edge, 1.30 Sharpe — and add 15 filtered Russell 3000 names on top. Two universes. One signal. Twenty-five positions. No landmines. Here’s what that looks like:
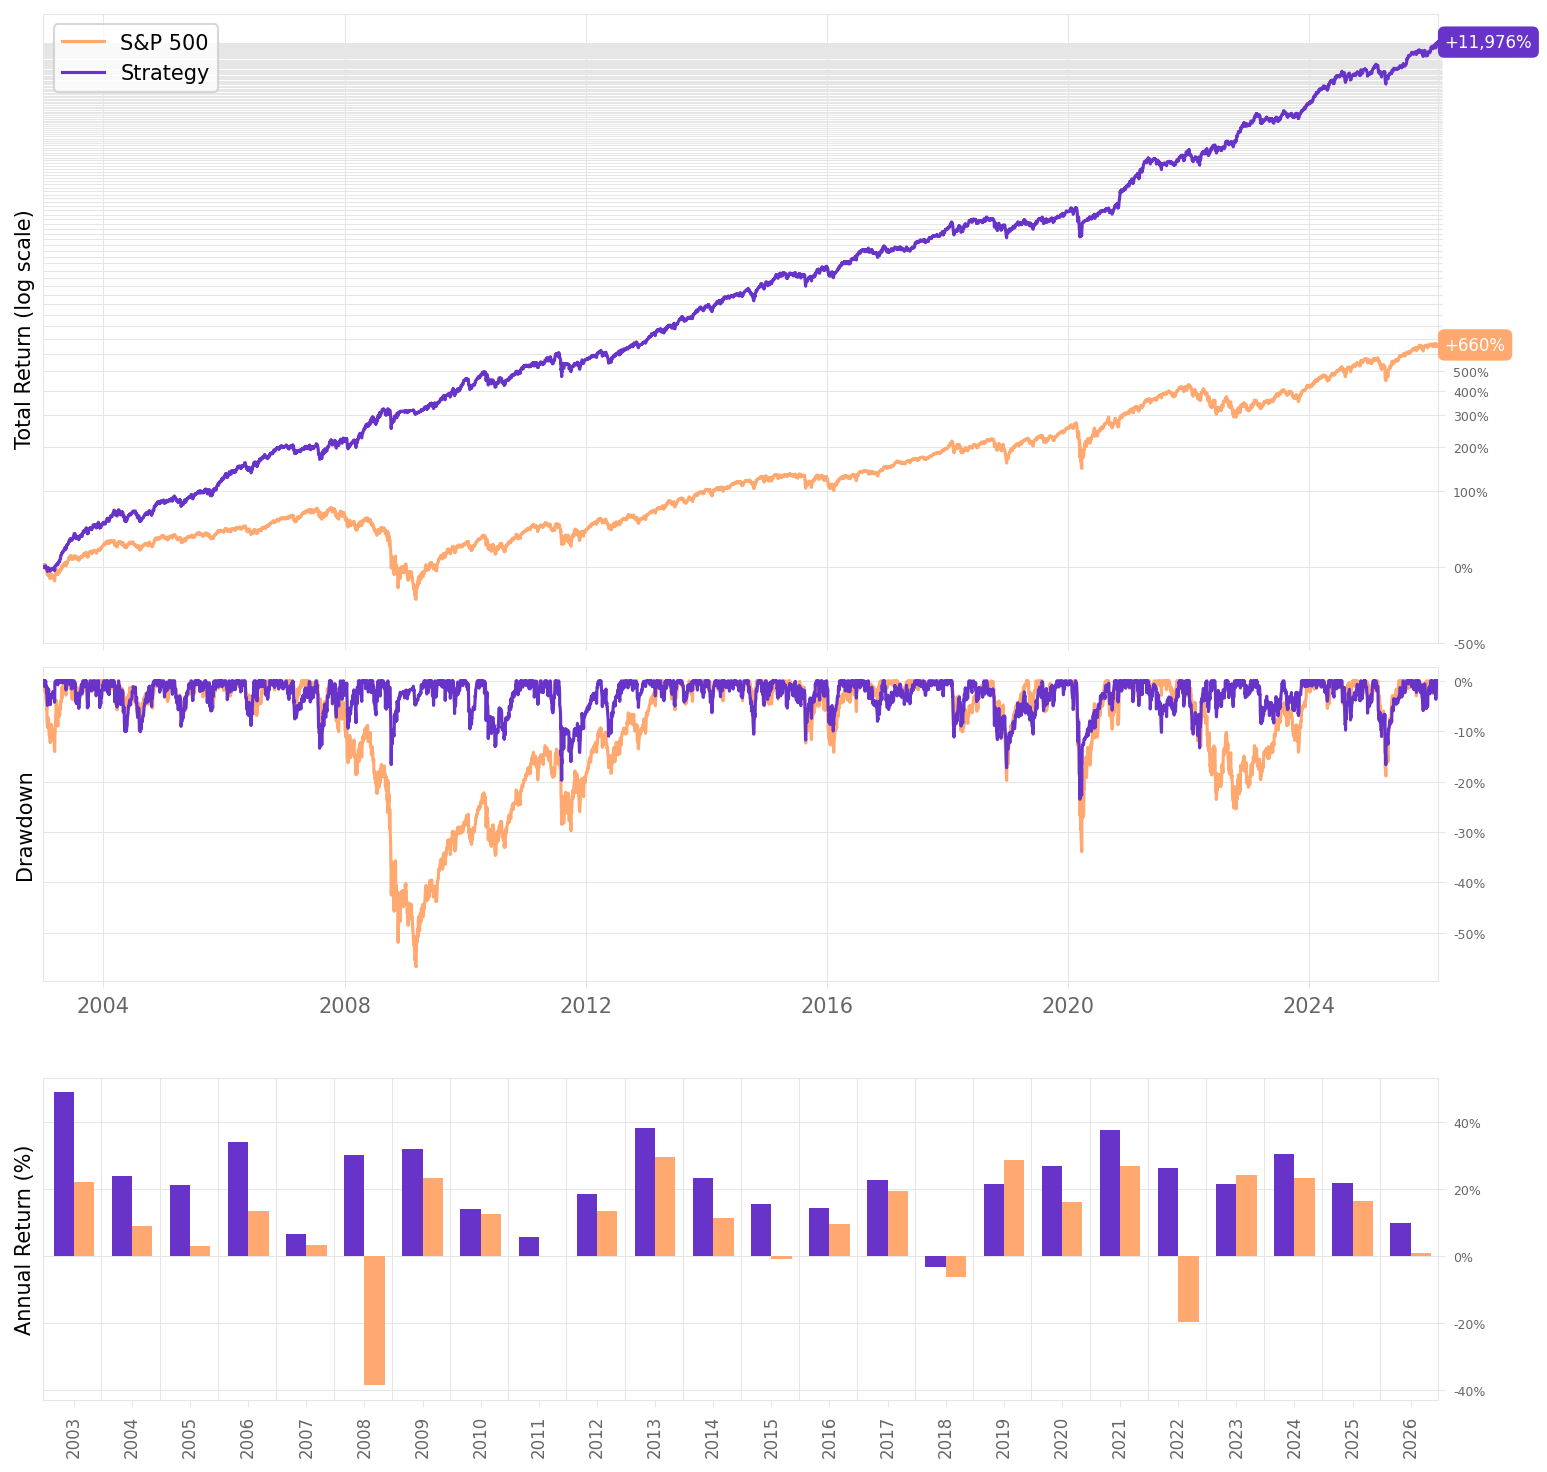
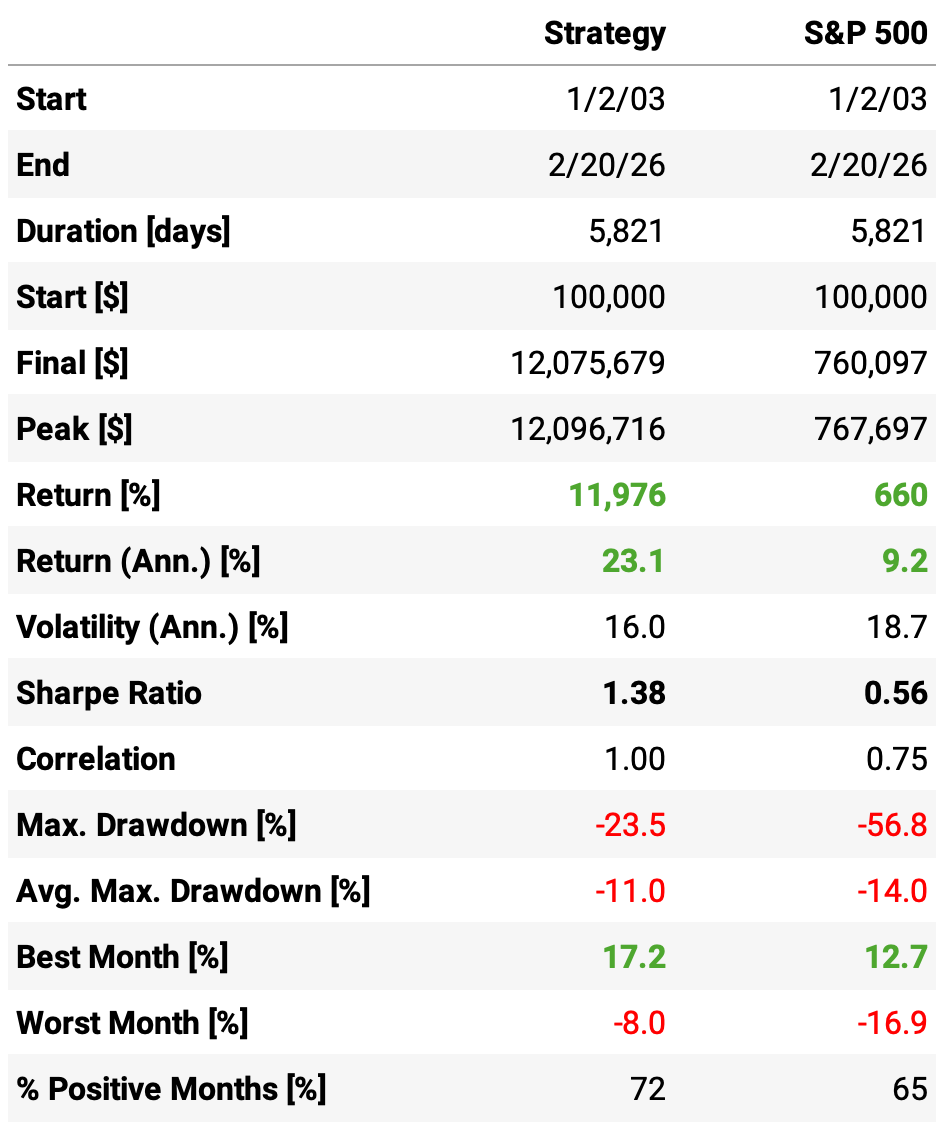
The numbers speak for themselves. But let’s spell them out anyway:
$100k became $12 million. The S&P 500 turned the same $100k into $760k. That’s not a comparison. That’s a different universe.
23.1% annualized return — with lower volatility than the benchmark. 16.0% vs 18.7%. More return, less risk. That’s the whole game.
Sharpe ratio: 1.38. Up from 1.30 in our S&P 500-only baseline. More bets didn’t dilute the edge. They improved it.
Max drawdown cut to less than half the benchmark: -23.5% vs -56.8%. During the worst moments in markets, this strategy gave back less than a half of what buy-and-hold did.
Worst month: -8.0%. Compare that to the benchmark’s -16.9% — or to the unfiltered Russell 3000’s -14.8%. The filter earned its keep.
72% positive months. Nearly three out of four months are winners. The S&P 500-only baseline posted 65%. The benchmark: 65%.
Compared to where we started — the S&P 500 baseline with a 1.30 Sharpe — we added 2 percentage points of annual return, improved the Sharpe, and kept drawdowns in a similar range.
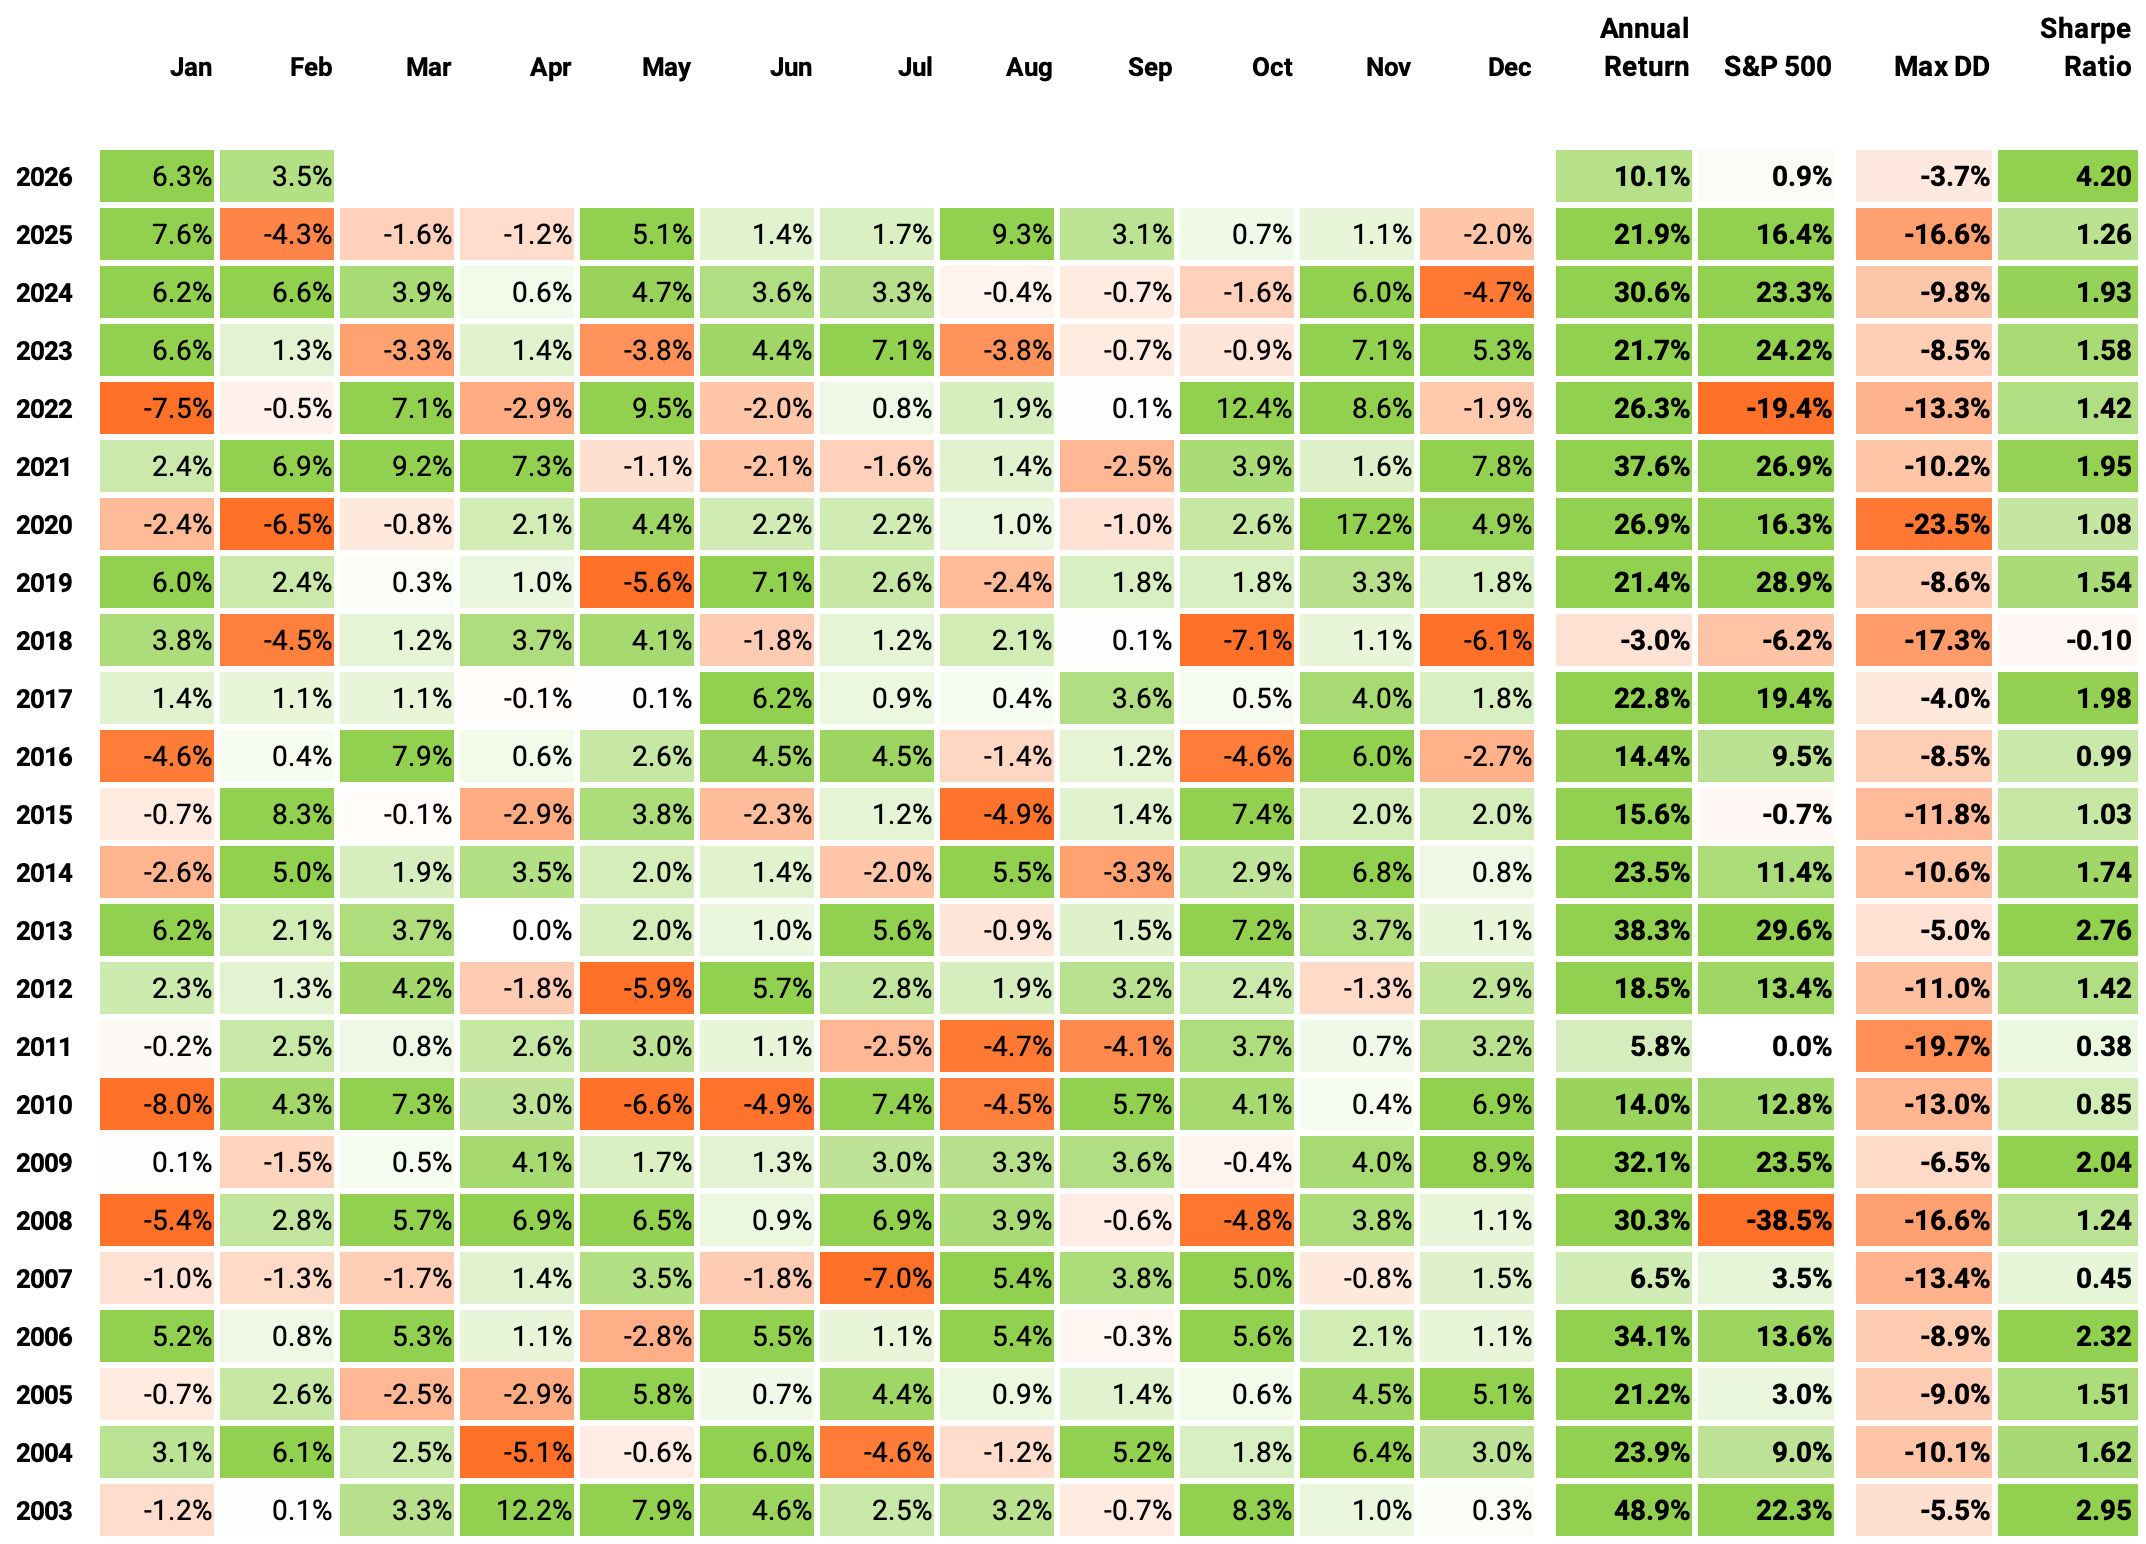
If we had traded this strategy since 2003:
We would have had only one negative year (2018);
We would have beaten the S&P 500 in 22 out of 24 years;
We would have seen 72% of the months positive, with the best at +17.2% (Nov’20);
We would have seen 28% of the months negative, with the worst at -8.0% (Jan’10);
The longest positive streak would have been 12 months, from May’05 to Apr’06;
The longest negative streak would have been 3 months, from Feb’25 to Apr’25.
Looking at the Fama-French 3-Factor risk model:
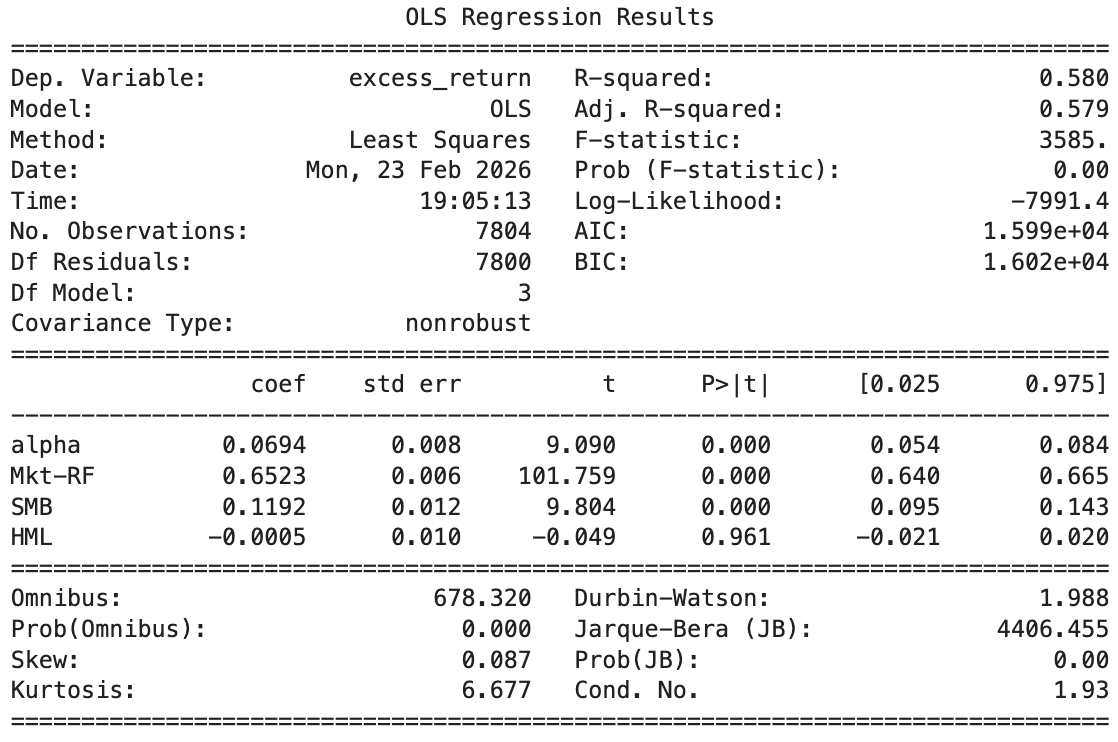
Daily alpha of 0.069%. That compounds to roughly 17.5% annualized (×252 trading days). The t-stat of 9.09 makes it statistically bulletproof.
Market beta of 0.65. The strategy captures about two-thirds of market moves — meaningful exposure but far from fully correlated. Lower risk than buy-and-hold.
Positive SMB loading (0.12, significant). The strategy tilts toward small caps, which makes sense for a Russell 3000 mean reversion approach — more of the universe is small.
HML loading is essentially zero (-0.0005, p = 0.96). No value/growth tilt at all. The edge isn’t coming from a value factor in disguise.
R² of 0.58. The three factors explain about 58% of the strategy’s variance. The other 42% — including the alpha — is idiosyncratic. That’s the edge.
Final thoughts
We started with a simple idea from Ed Thorp: if you have an edge, you want more bets. We took a proven mean reversion strategy on the S&P 500 — a 1.30 Sharpe with one down year in twenty-two — and asked whether we could expand it to the Russell 3000 without losing the edge.
The naive answer was no. More stocks meant more noise, fatter tails, and worse drawdowns. But the edge per trade was still there — buried under blow-ups from dangerous names. One filter changed everything. By checking each stock’s rolling CVaR 5% before entering, we removed the landmines and kept the signal. The result: a 1.38 Sharpe, 23.1% annualized return, and a max drawdown less than half the benchmark’s. Not by finding a better signal. By making better bets.
There’s more to explore:
Dynamic position sizing: scaling exposure based on volatility regimes or signal strength;
Sector and liquidity constraints: stress-testing the filter under real-world execution limits;
Hedging overlays: applying beta hedging to further compress drawdowns without giving up alpha.
For those who want to know more about Ed Thorp, his book A Man for All Markets is essential reading. The podcast episode below is a great companion. Worth every minute:
Thorp’s life is the blueprint for anyone chasing more than just money.
As always, I’d love to hear your thoughts. Feel free to reach out via Twitter or email if you have questions, ideas, or feedback.
Cheers!
Course and Community: enrollments Open
As many of you requested, the 3rd cohort of the course is now live and open for enrollment.
It walks through my codebase step by step and is designed for readers who want to develop quant strategies using the same approach I’ve shared here.
You’ll find all the details—content, structure, pricing, and FAQs—at the link below. If you have any questions, feel free to reach out.
Enrollment also includes access to the private community and an ever-growing library of study groups.
Great piece! did you rebalance SP/Russell every year or just use the current baskets? (constituents change every year). If so, where do you find historical constituent data? i’ve had a tough time finding that in the past trying to test strategies on index constituents
Thank you!