

The idea
“The only sustainable competitive advantage is to learn faster than your competition.” Arie de Geus
Implementing research papers can sometimes work, though a perfect replication often fails. It’s never wasted effort, though: the ideas in the paper end up feeding new ideas and good conversations with other researchers.
Here’s the 4th edition of the Quantitativo weekly, featuring papers that caught my eye over the past week. Enjoy!
25 factors. 11 models. The one that did no estimation at all won.
A new paper maps stock selection within sectors across 25 years of S&P 500 data, and arrives at a humbling result: how you combine factors matters far more than how cleverly you estimate the combination.
Short interest is the single most reliable signal: pervasive and immune to the decay that killed most value factors after 2012.
Within-sector momentum is dead, except in Utilities and under stress.
Selection pays only when the macro is scared: the edge climbs from ~0 in calm regimes to 0.04 in stressed ones.
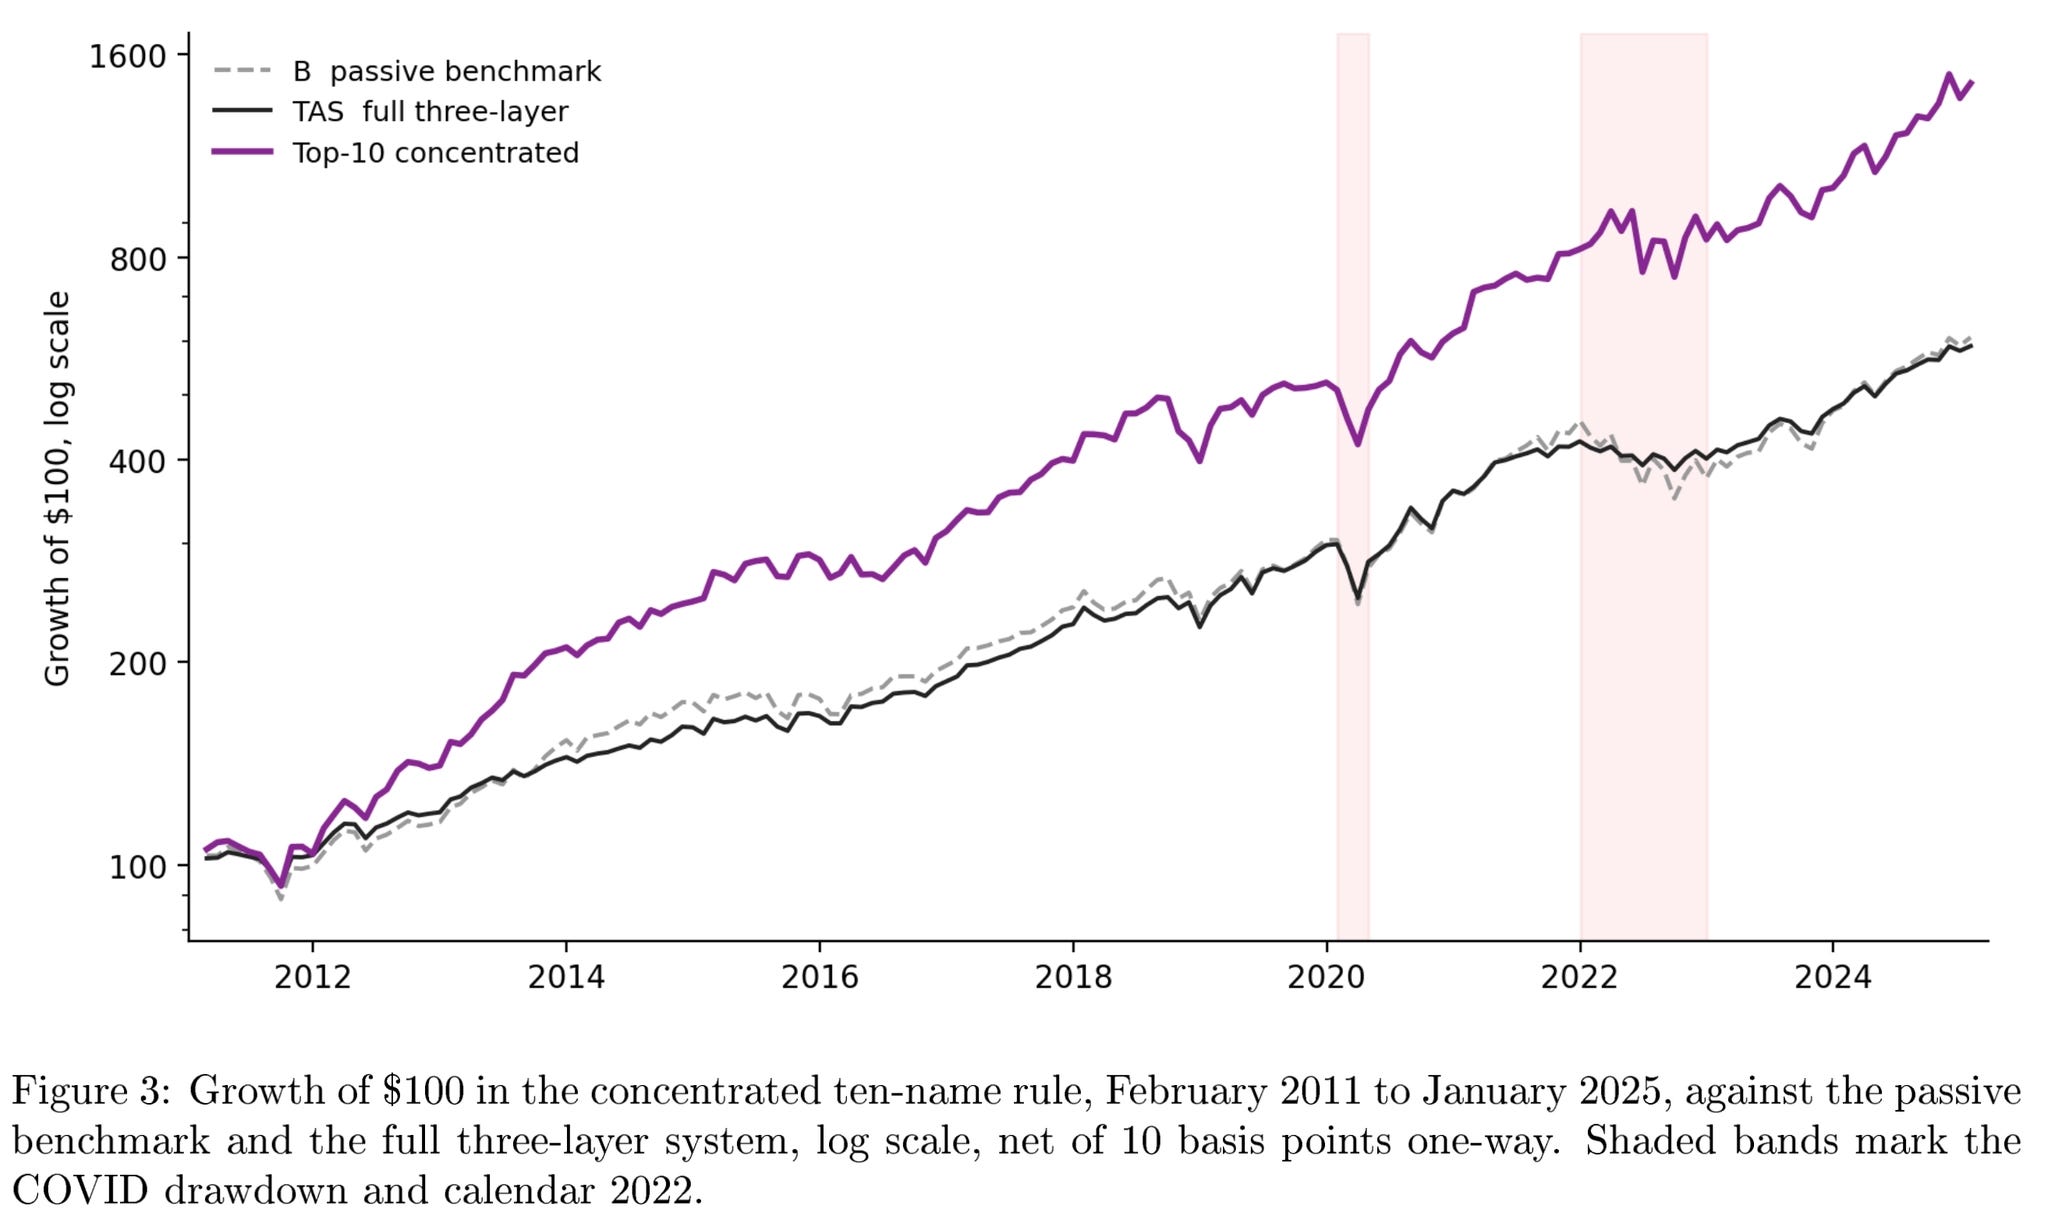
The three-layer system (timing → rotation → selection) lifts a passive Sharpe from 0.89 to 1.12 and beat the index by 12.2 points in 2022.
The kicker: a concentrated 10-name version turned $100 into $1,450 (vs. $608 passive), 20.8% a year.
11 famous anomalies. Strip out the crowded stocks, and every single one stops working.
A new paper finds that the returns to well-known stock market anomalies aren’t spread evenly: they’re hiding almost entirely in the most crowded names.
Using institutional 13F holdings from 1980-2021 and a crowding measure called Days-ADV (how many days it’d take institutions to exit a position), the authors show:
A long/short crowding strategy earns ~17% a year (1.44% monthly alpha, t = 9.67),
Buying crowded long-leg + shorting uncrowded short-leg anomaly stocks earns 1.7%/month (t = 11.1), 4x a plain anomaly sort,
Remove the crowded stocks and none of the 11 anomalies produce positive alpha,
The edge survives publication, unlike most anomalies.
The catch? Crowding is compensation for crash risk: these portfolios fell hardest in 2008 and COVID. The alpha is real, but so is the tail.
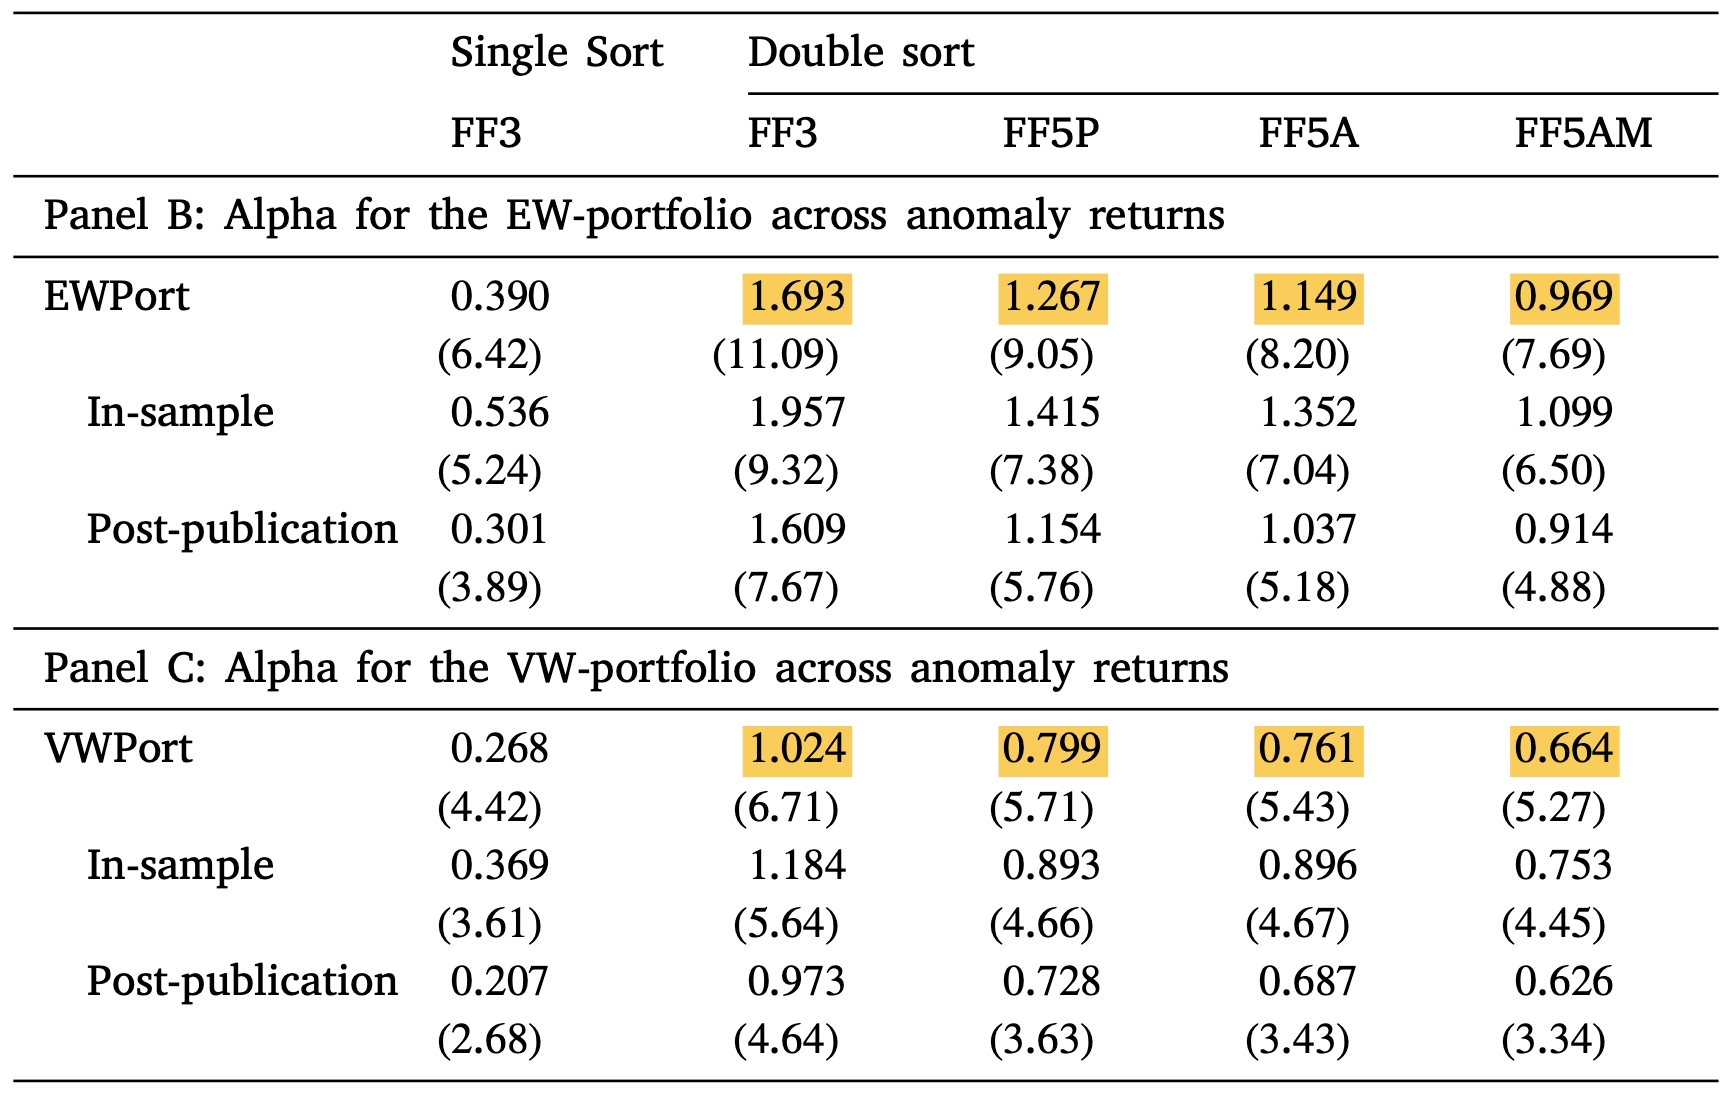
Crowded Spaces and Anomalies by Chincarini, Lazo-Paz & Moneta (2026), Journal of Banking and Finance
312 strategies. 84% beat the market, including the ones built on signals that predict nothing.
A new paper shows that “style investing” creates a price distortion far bigger than the value/momentum anomalies we usually talk about. When investors chase whichever stock category is hot, their feedback trading leaves a predictable footprint across 312 firm characteristics, not just a famous few.
The kicker: the style version of a signal works even when the underlying characteristic has zero predictive power.
Stronger when comovement is high, institutions pile in, and retail chases the trend,
Stronger for simple, easy-to-compute characteristics (not complex ones, which kills the “underreaction” story),
42,000+ random accounting ratios as a placebo? Mostly nothing. The effect needs real economic content.
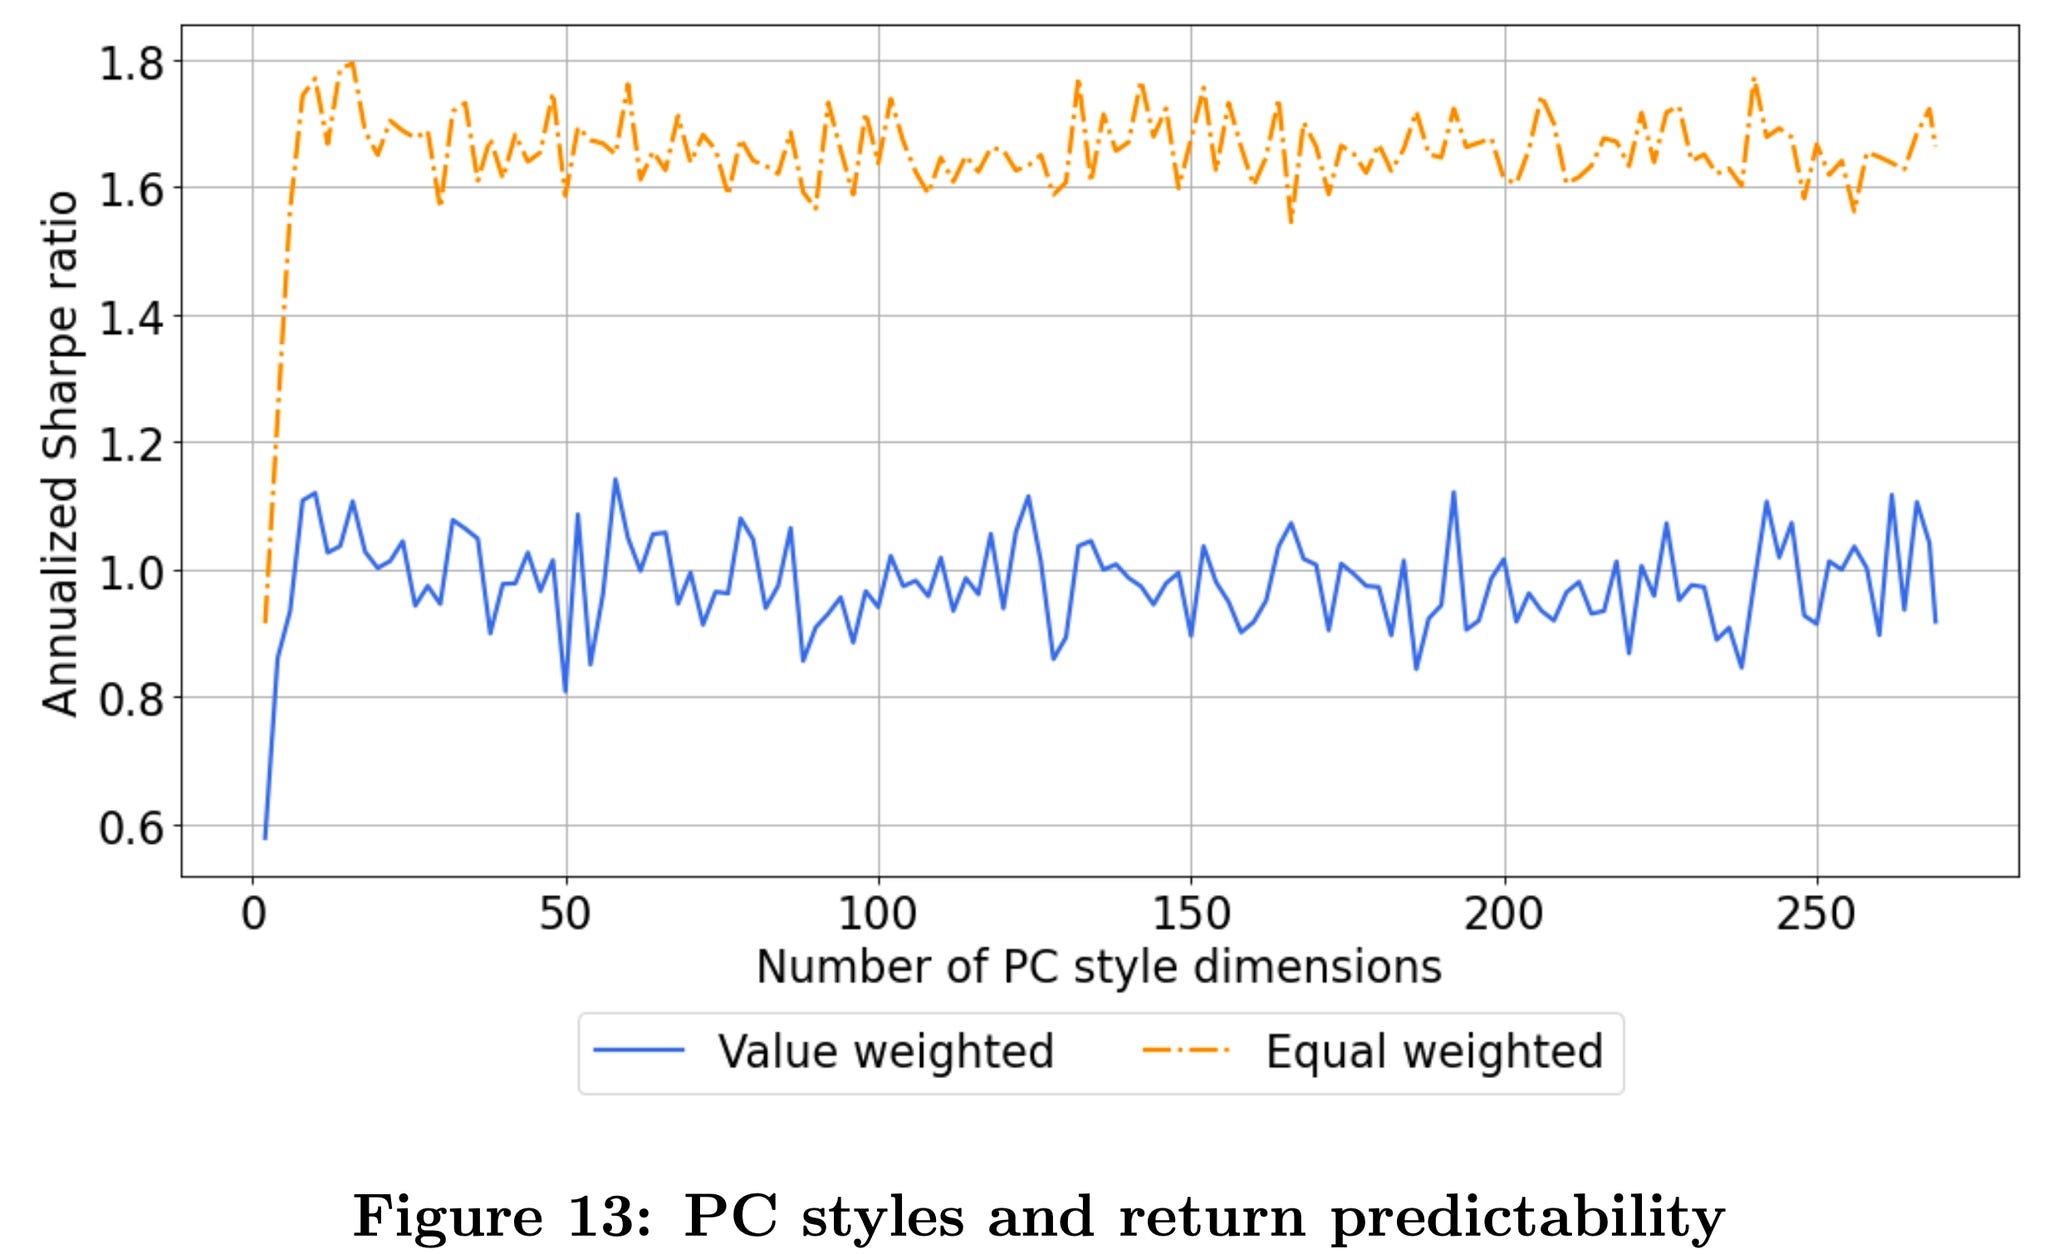
Push the dimensionality with k-means clustering and you get ~29% annualized returns at a 1.16 Sharpe (yet a sparse 6-8 PC model captures almost all of it).
A clean behavioral explanation for factor momentum.
Max drawdown: 54% → 26%. The only input? Last month’s market return.
A new paper shows that the predictive power of lagged market returns on industry returns is nearly invisible to standard regressions. That’s because it doesn’t live in the average: it lives in the downside tail.
Using quantile regressions, the author finds that a weak market month predicts a worse left tail for most industries next month, while saying almost nothing about normal or median outcomes. That’s why OLS finds “nothing.”
The strategy built on this is refreshingly simple:
Summarize the market with one number: the standardized market excess return,
Find the historical months that looked most similar to today,
Go long industries that did well after those states, short the ones that didn’t.
No regimes. No business-cycle labels. No fitted forecasts.
The payoff isn’t a flashier return, it’s risk: Sharpe rises (0.56 → 0.71), volatility drops ~4 points, and max drawdown is roughly halved. Robust across 6 industry classifications and every parameter the author tests.
A reminder that “no edge on average” and “no edge anywhere” are very different statements.
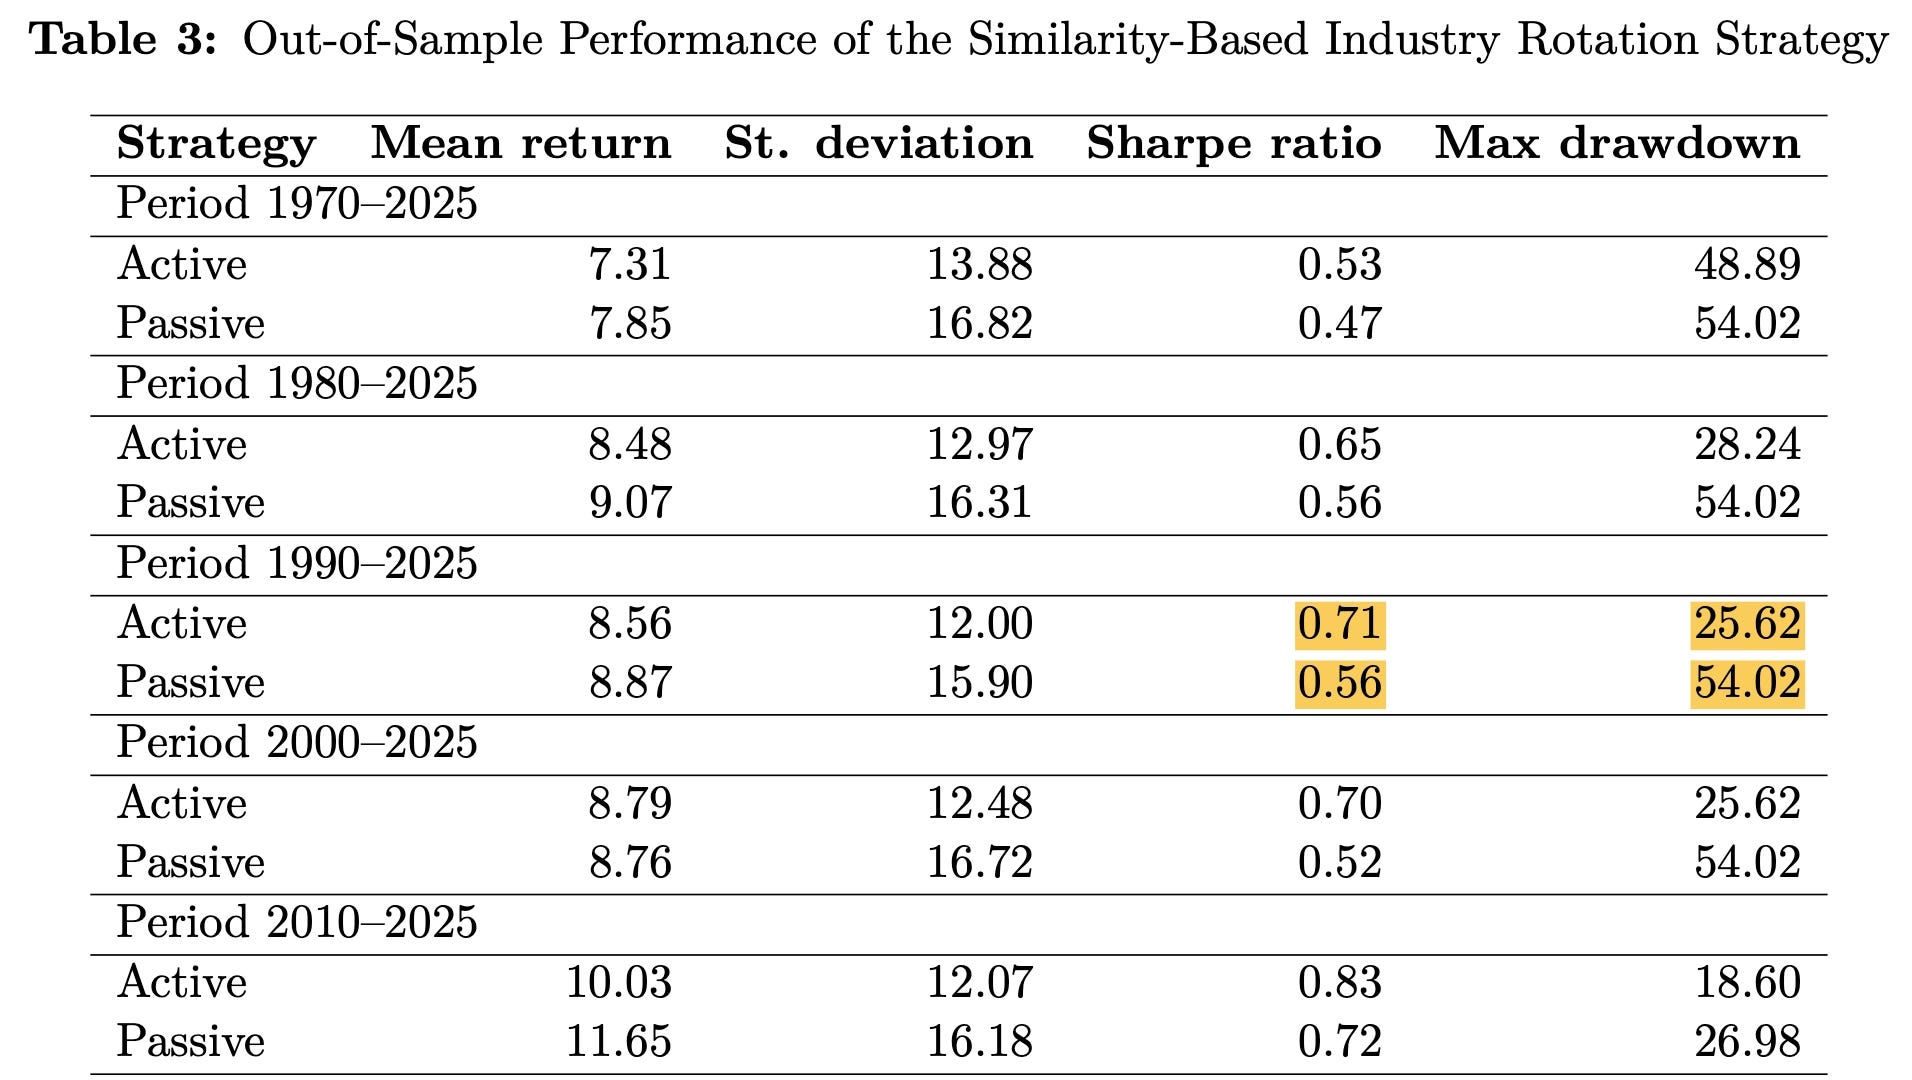
Industry Rotation Using Market-State Similarity by Valeriy Zakamulin (2026)
41 head-to-head matchups. Factors won every single one.
A study in the Journal of Asset Management pits investable factor ETFs against sector ETFs across 6 allocation methods, 4 estimation windows, and 3 constraint regimes: 13.5 years out-of-sample, transaction costs included.
Factor portfolios beat sectors on Sharpe in 100% of pairs (1.07-1.38 vs. 0.37-1.13),
Higher returns and lower volatility (not a hidden tail-risk trade),
Lower turnover, so the edge grows as costs rise,
Dynamic allocation adds alpha over buy-and-hold factors (up to 1.22%/month).
The catch? Split by NBER recessions and it flips: sectors win in crises, factors win in expansions. GFC and Covid both went to sectors. The 10-year expansion in between went to factors, which is why the full sample looks so one-sided.
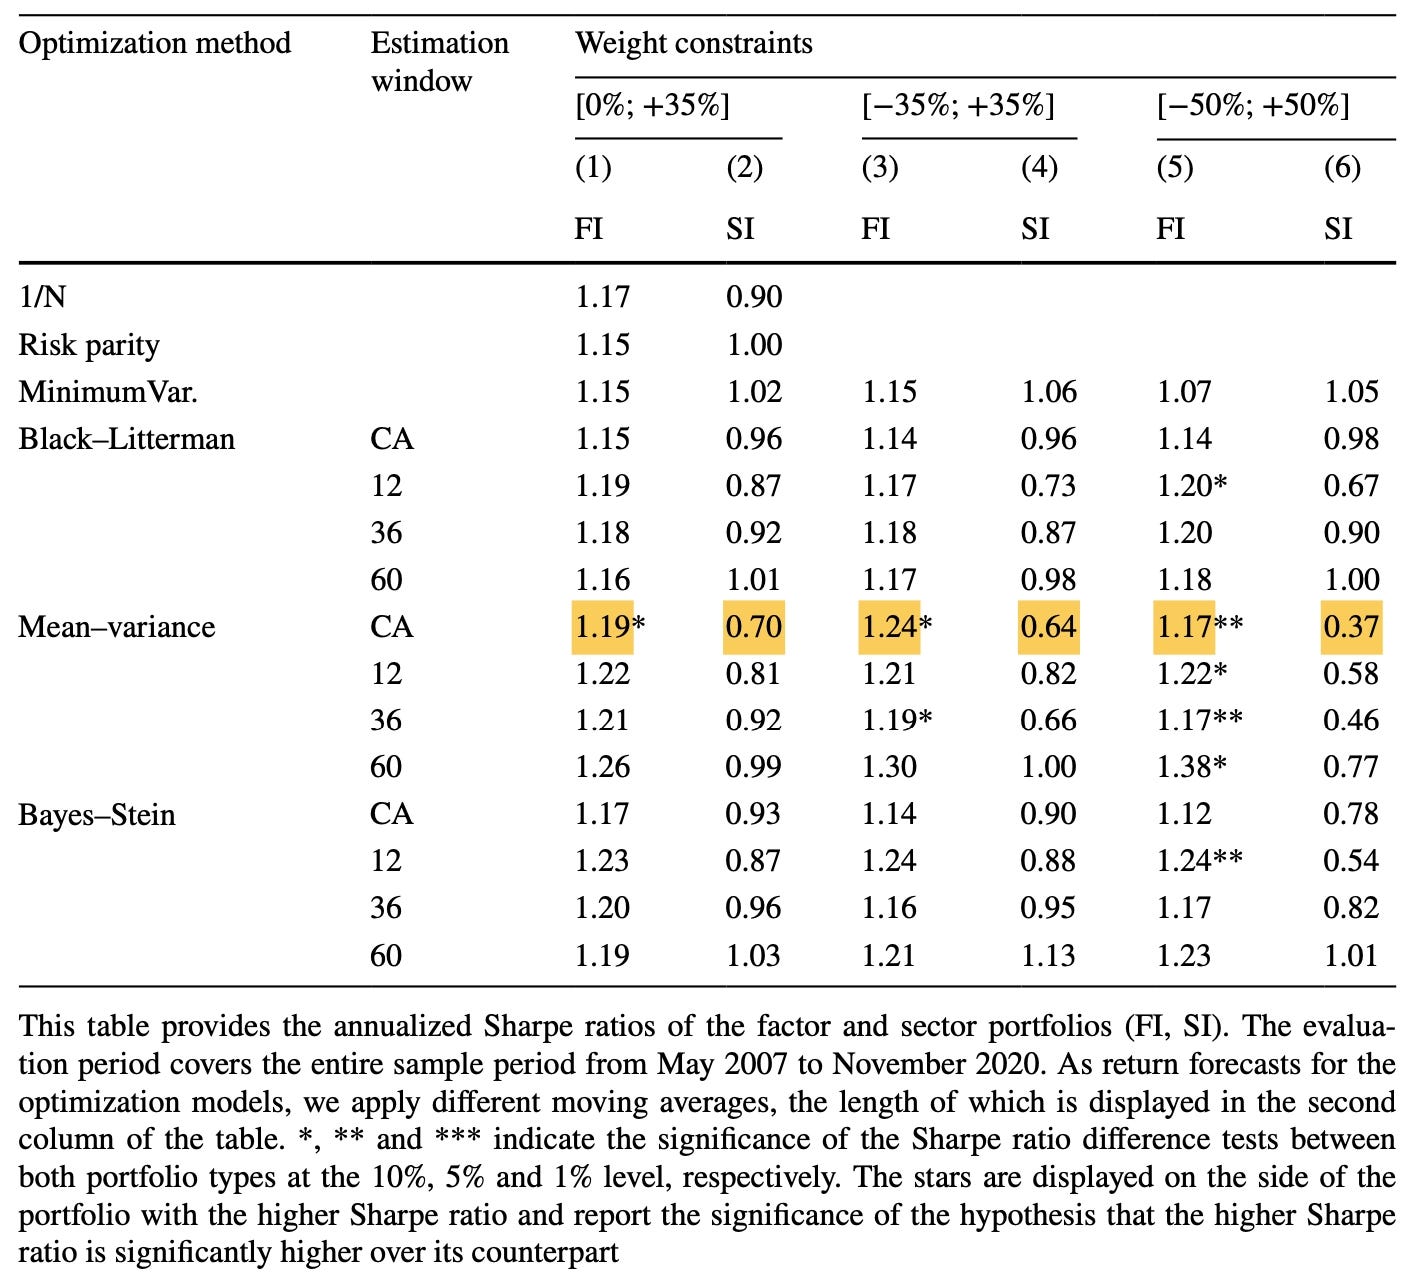
Factor investing and asset allocation strategies: a comparison of factor versus sector optimization by Bessler, Taushanov & Wolff (2021)
As always, I’d love to hear your thoughts. Feel free to reach out via Twitter or email if you have questions, ideas, or feedback.
Cheers!
The crowding paper is the real gut check here — that all 11 anomalies lose their edge once you strip out the crowded names means the "anomaly" was never independent of positioning to begin with. That maps onto what we see with backtested strategies generally: an edge concentrated in one narrow regime (here, crowded/momentum-chasing conditions) tends to evaporate exactly in the tail, when it matters most. We ran 50+ pre-registered backtests and none survived out-of-sample cleanly for that same reason — the crash-risk tail is where the real test happens, not the average month.