

The idea
“The value of an idea lies in the using of it.” Thomas Edison.
In my experience, implementing research papers can sometimes work, though a perfect replication often fails. It’s never wasted effort, though: the ideas in the paper end up feeding new ideas and good conversations with other researchers.
Here’s the 2nd edition of the Quantitativo weekly, featuring papers that caught my eye over the past week. Enjoy!
Momentum’s 10 worst months in a century. One-line tweak lost less in all 10.
A new paper proposes a factor with zero parameters: multiply classic 12-1 momentum by last month’s gross return.
B = (1 + r) · M
That’s it. And it’s an exact identity, not an approximation.
Why it works: winners glide, losers stumble:
Winners trend up smoothly. Losers fall in fits and starts, punctuated by rebounds that fade.
Among losers, one-month reversal is 3.5× stronger than among winners.
(1 + r) shorts the rebounded losers harder, and the still-falling ones less.
The results (U.S. 1927-2025, plus 12 markets):
Sharpe 0.38 → 0.78, and 100% of the gain is on the short leg
Survives FF5 + UMD + STR (8.5%/yr, t = 6). It’s conditional reversal, not the reversal factor in disguise.
Skewness improves 3.68 → -2.73. It mitigates momentum crashes instead of amplifying them.
Positive in all 12 markets tested (sign test p = 0.002)
The best part? The authors bound their own claim: the big number is equal-weighted, and once you cut to a genuinely shortable universe, the harvestable premium is ~1-2% a year. Not a standalone alpha… a precise upgrade to momentum’s weakest leg.
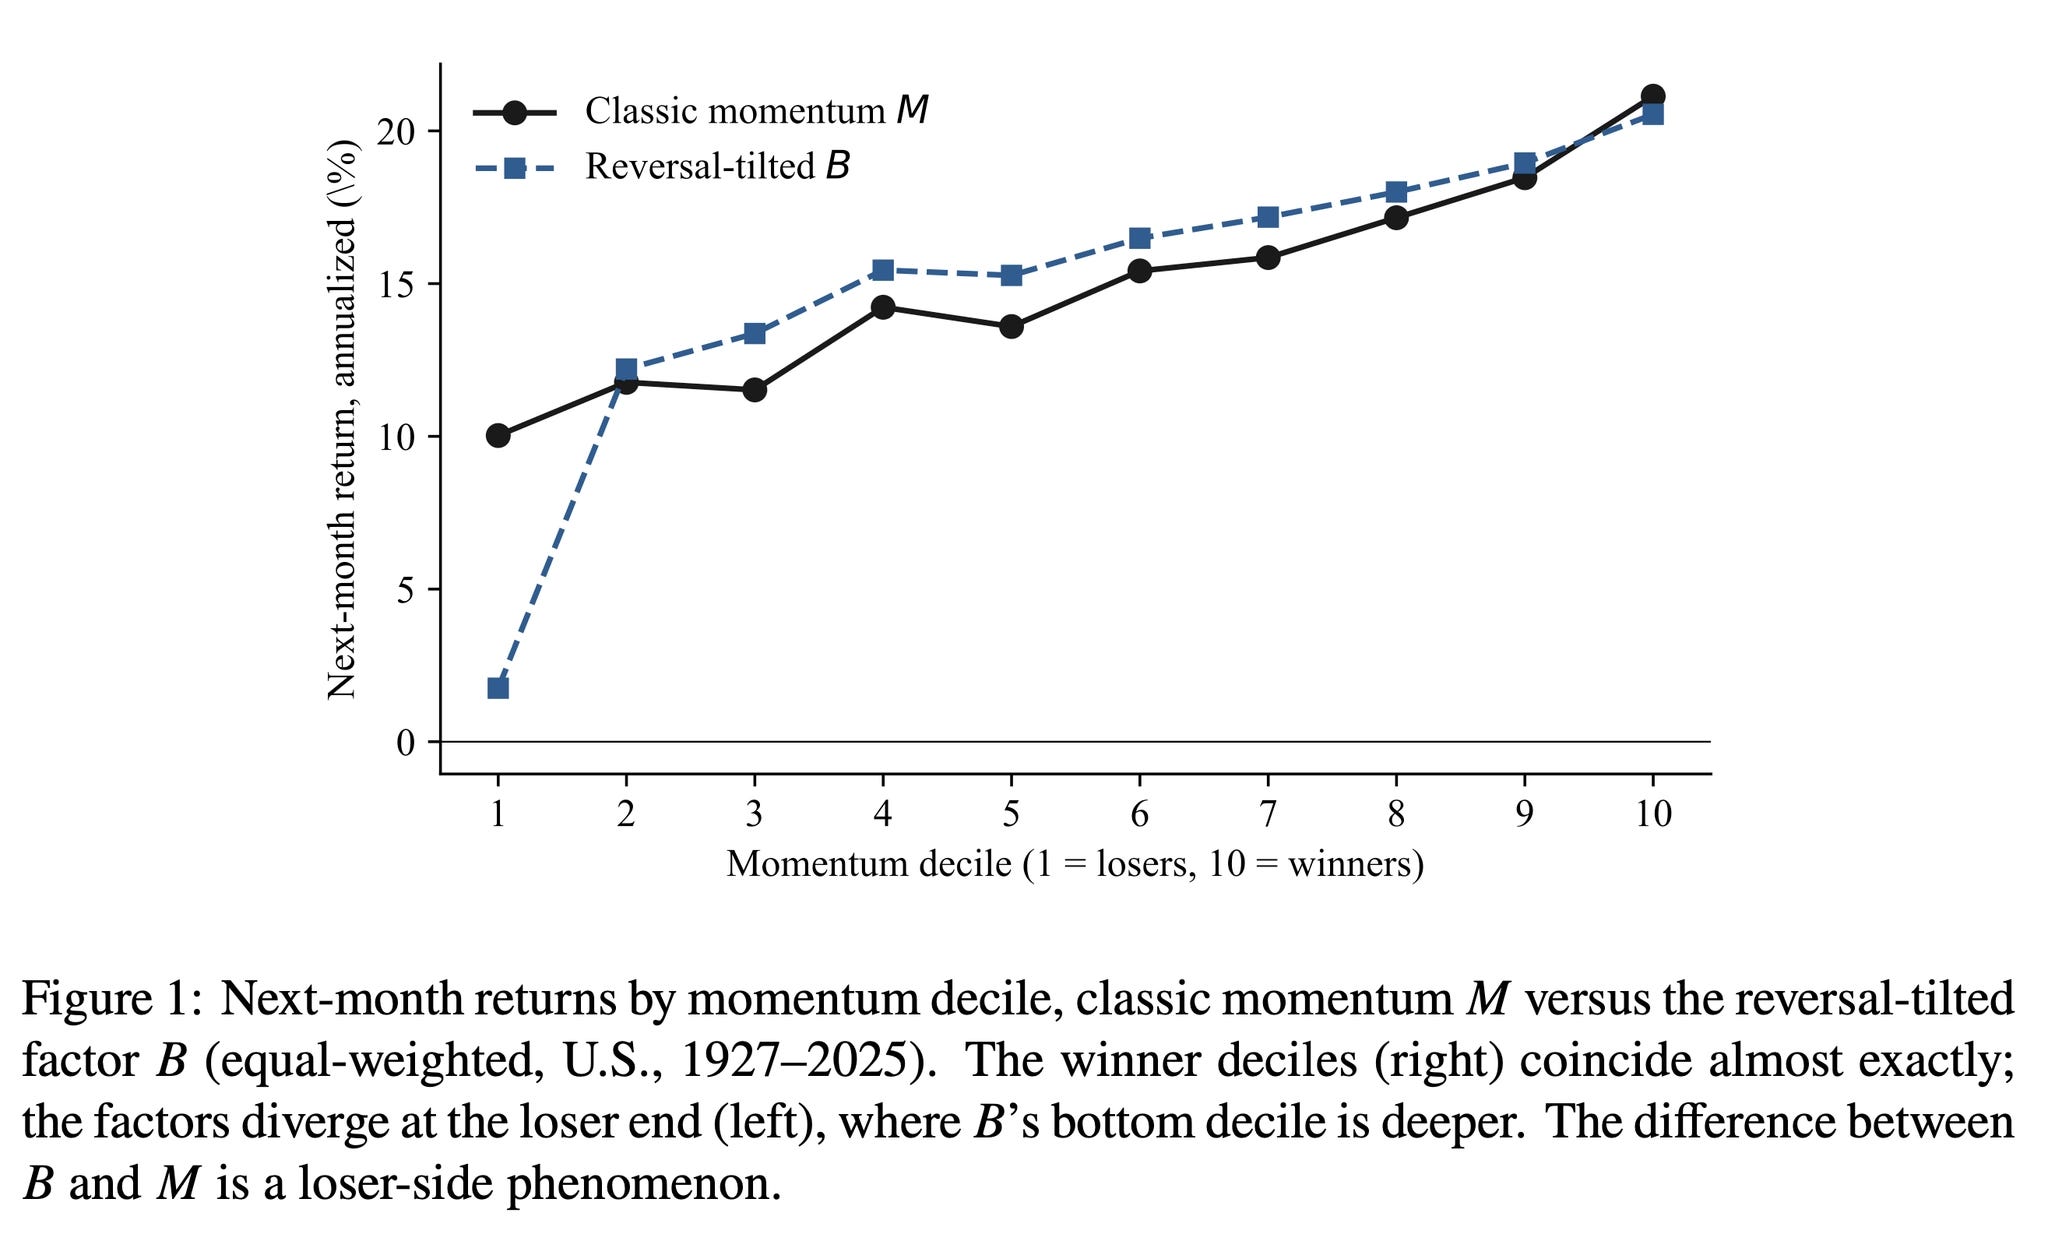
Winners Glide, Losers Stumble: A Behavioral Reversal Tilt to Momentum
200 years of profit. A Sharpe that fell from 0.84 to 0.12. And a culprit almost no one watches: tick size.
Trend following is one of the most robust anomalies in all of finance, profitable across two centuries and nearly every liquid market. Then, around 2009, fast trends simply stopped working. A new paper from the team at CFM (including Jean-Philippe Bouchaud) finally offers a convincing “why.”
It’s not capacity. It’s not electronification. It’s not a simple crowding story.
The single variable that separates dead trends from surviving ones is the volatility-normalised tick size:
On small-tick contracts (equity indices, FX), fast-trend PnL has completely collapsed since 2008.
On large-tick contracts (bonds, most commodities), trend is essentially untouched.
Neither asset class nor liquidity reproduces this clean split.
The mechanism? Trend is a self-fulfilling loop: signal → trade → price impact → reinforced signal. HFT market makers now withdraw liquidity in front of predictable CTA flow. On sparse small-tick books, that severs the loop: trend followers retreat, and the signal itself decays, not just the profits.
The kicker: even with zero execution cost, small-tick trends stay flat. So it’s not that trend got too expensive to trade: the underlying edge is gone.
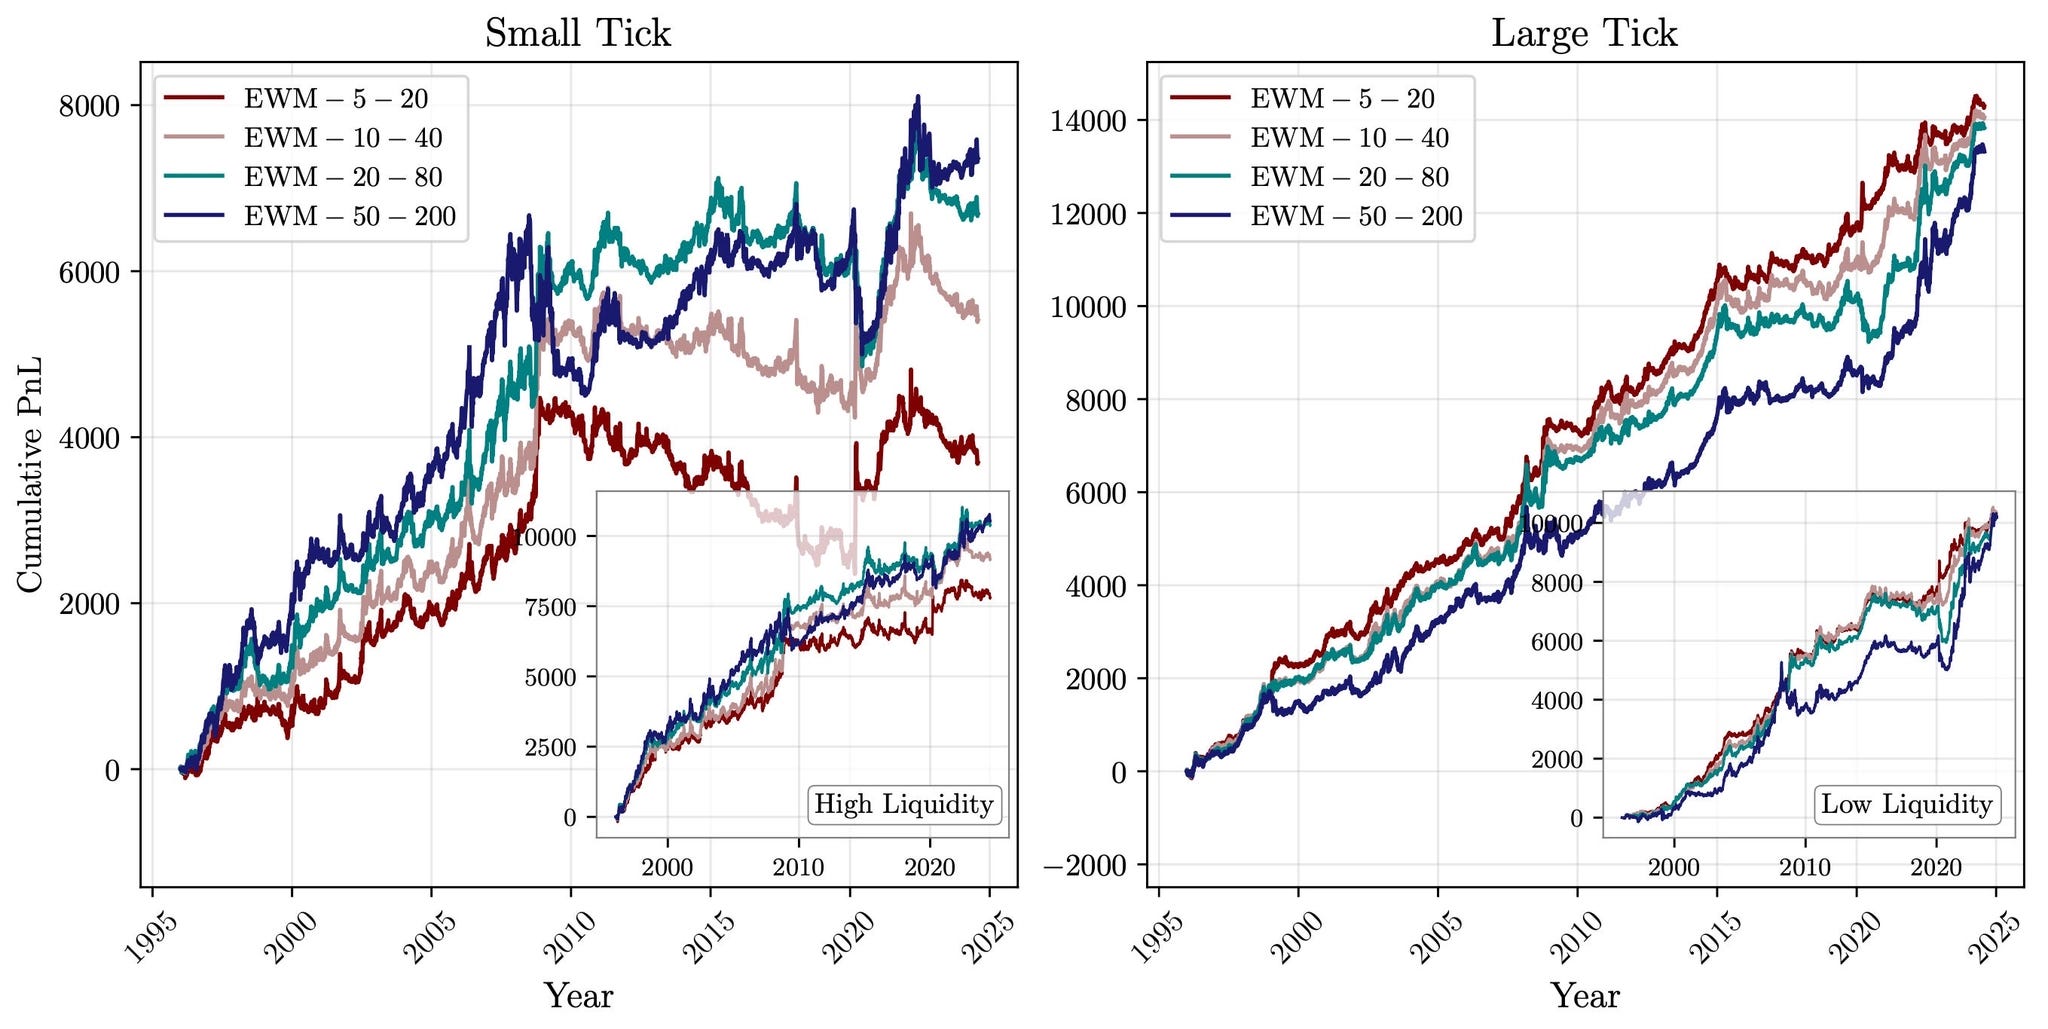
Is Trend Still Your Friend?: A Microstructural Account of the Demise of Short-Term Trend-Following
$104 vs $27. A 14-factor model can’t explain the gap. Neither can a neural network.
A new paper in the Journal of Financial Economics shows that a stock’s future returns are forecast by something most models ignore: the strength of its industry peers and where it ranks within that group.
The authors compress this into a single Peer Index (PI), and the results are hard to wave away:
A long/short PI strategy turned $1 into $104 since 1980, vs $27 for the market.
The edge survives a 14-factor model and isn’t subsumed by gradient-boosted trees, random forests, or neural nets trained on 130 firm-level characteristics.
It works across every market state: high/low volatility, liquidity, and sentiment, unlike most anomalies.
Prices drift the right way and never reverse, pointing to slow underreaction to peer information, not risk or hype.
It was even more resilient in crises, gaining 19.7% during the GFC while the market dropped 38.3%.
The takeaway: markets price stocks as if they were islands. They’re not.
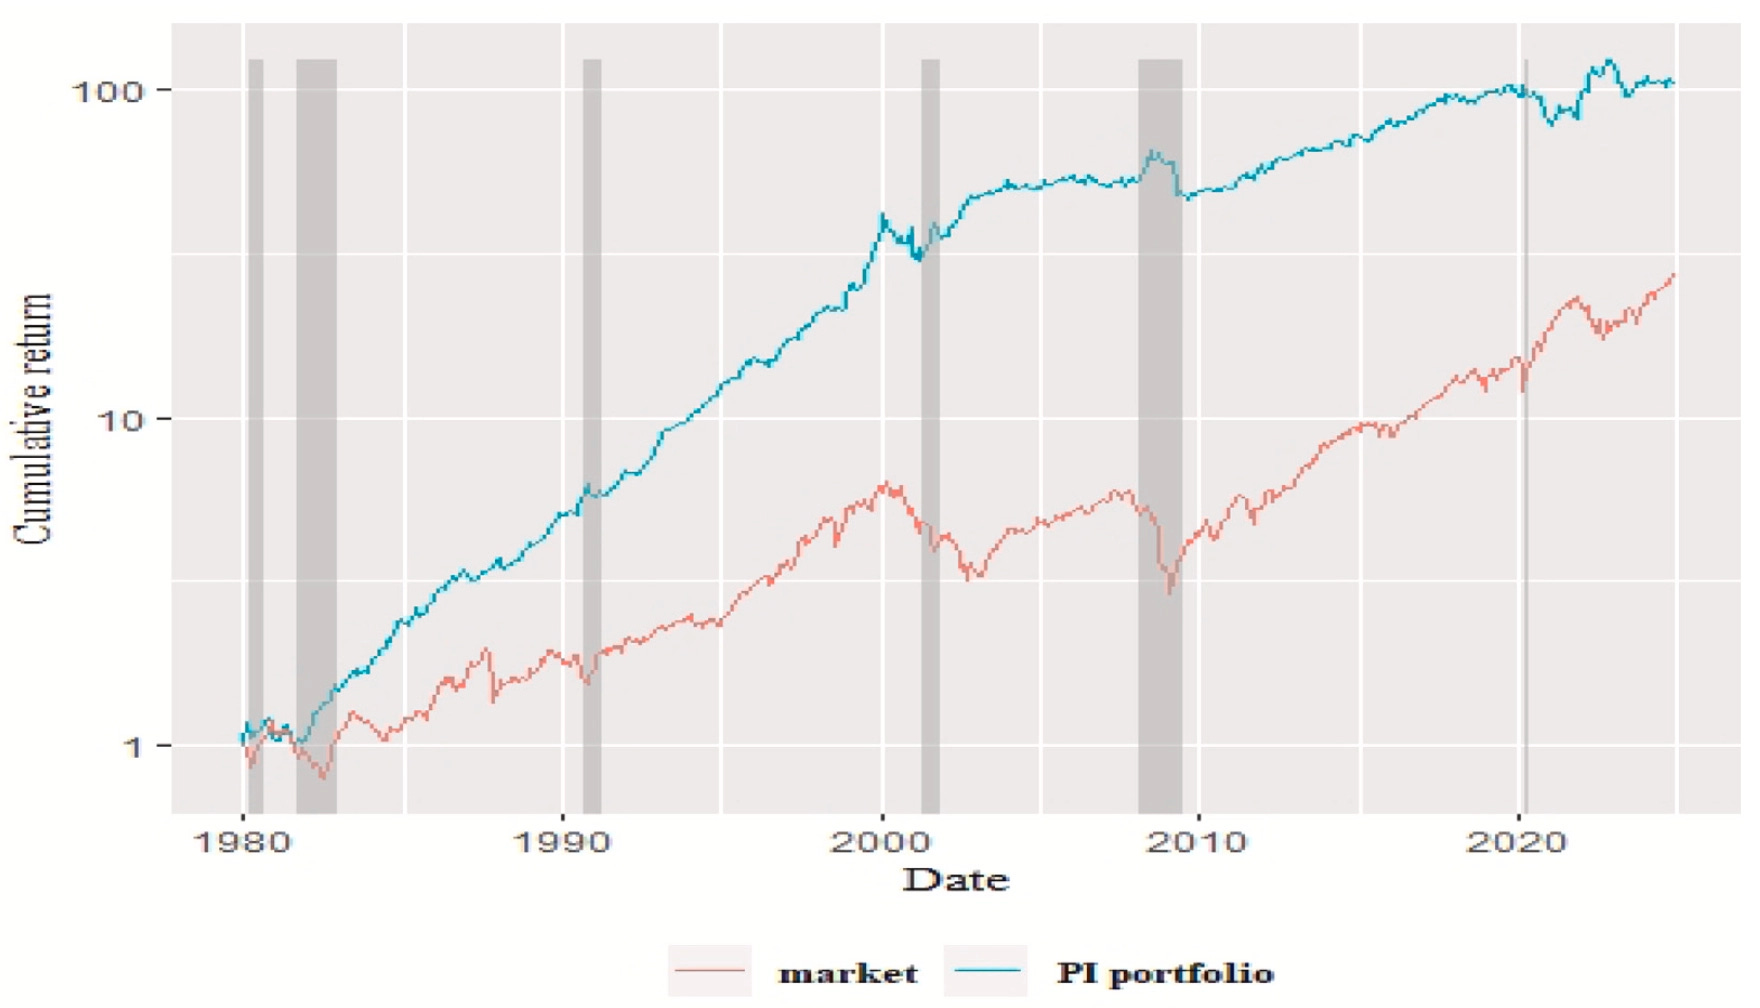
Dual peer effects and cross-stock predictability
13% annual returns. Sharpe of 0.65. A 12-month-persistent signal hiding inside CFTC position data.
A new paper just dropped showing that commodity speculators extrapolate past returns, and you can systematically front-run their behavior.
The authors build a novel Degree of Extrapolation (DOX) measure from non-commercial trader positions over 26 U.S. commodities (1986–2024):
A long/short DOX portfolio earns 13.11% per year with a Sharpe of 0.65, beating conventional momentum.
Returns persist up to 12 months (no quick reversal: this isn’t a bubble story).
Survives every known commodity factor: term structure, basis-momentum, hedging pressure, value, multi-horizon momentum. Alpha stays at 0.71-0.93% per month.
Extending the same logic to the futures curve (Basis-DOX) delivers an even better Sharpe of 0.78, the highest in the paper.
The mechanism is not mispricing. It’s liquidity provision: extrapolative speculators pile in after good returns, then slowly unwind, paying commercial hedgers a premium to take the other side. The 2021 CFTC position-limit reform serves as a clean exogenous shock confirming the story.
Bonus: DOX explains why momentum and value work in commodities: momentum lives in high-DOX names, value lives in low-DOX ones.
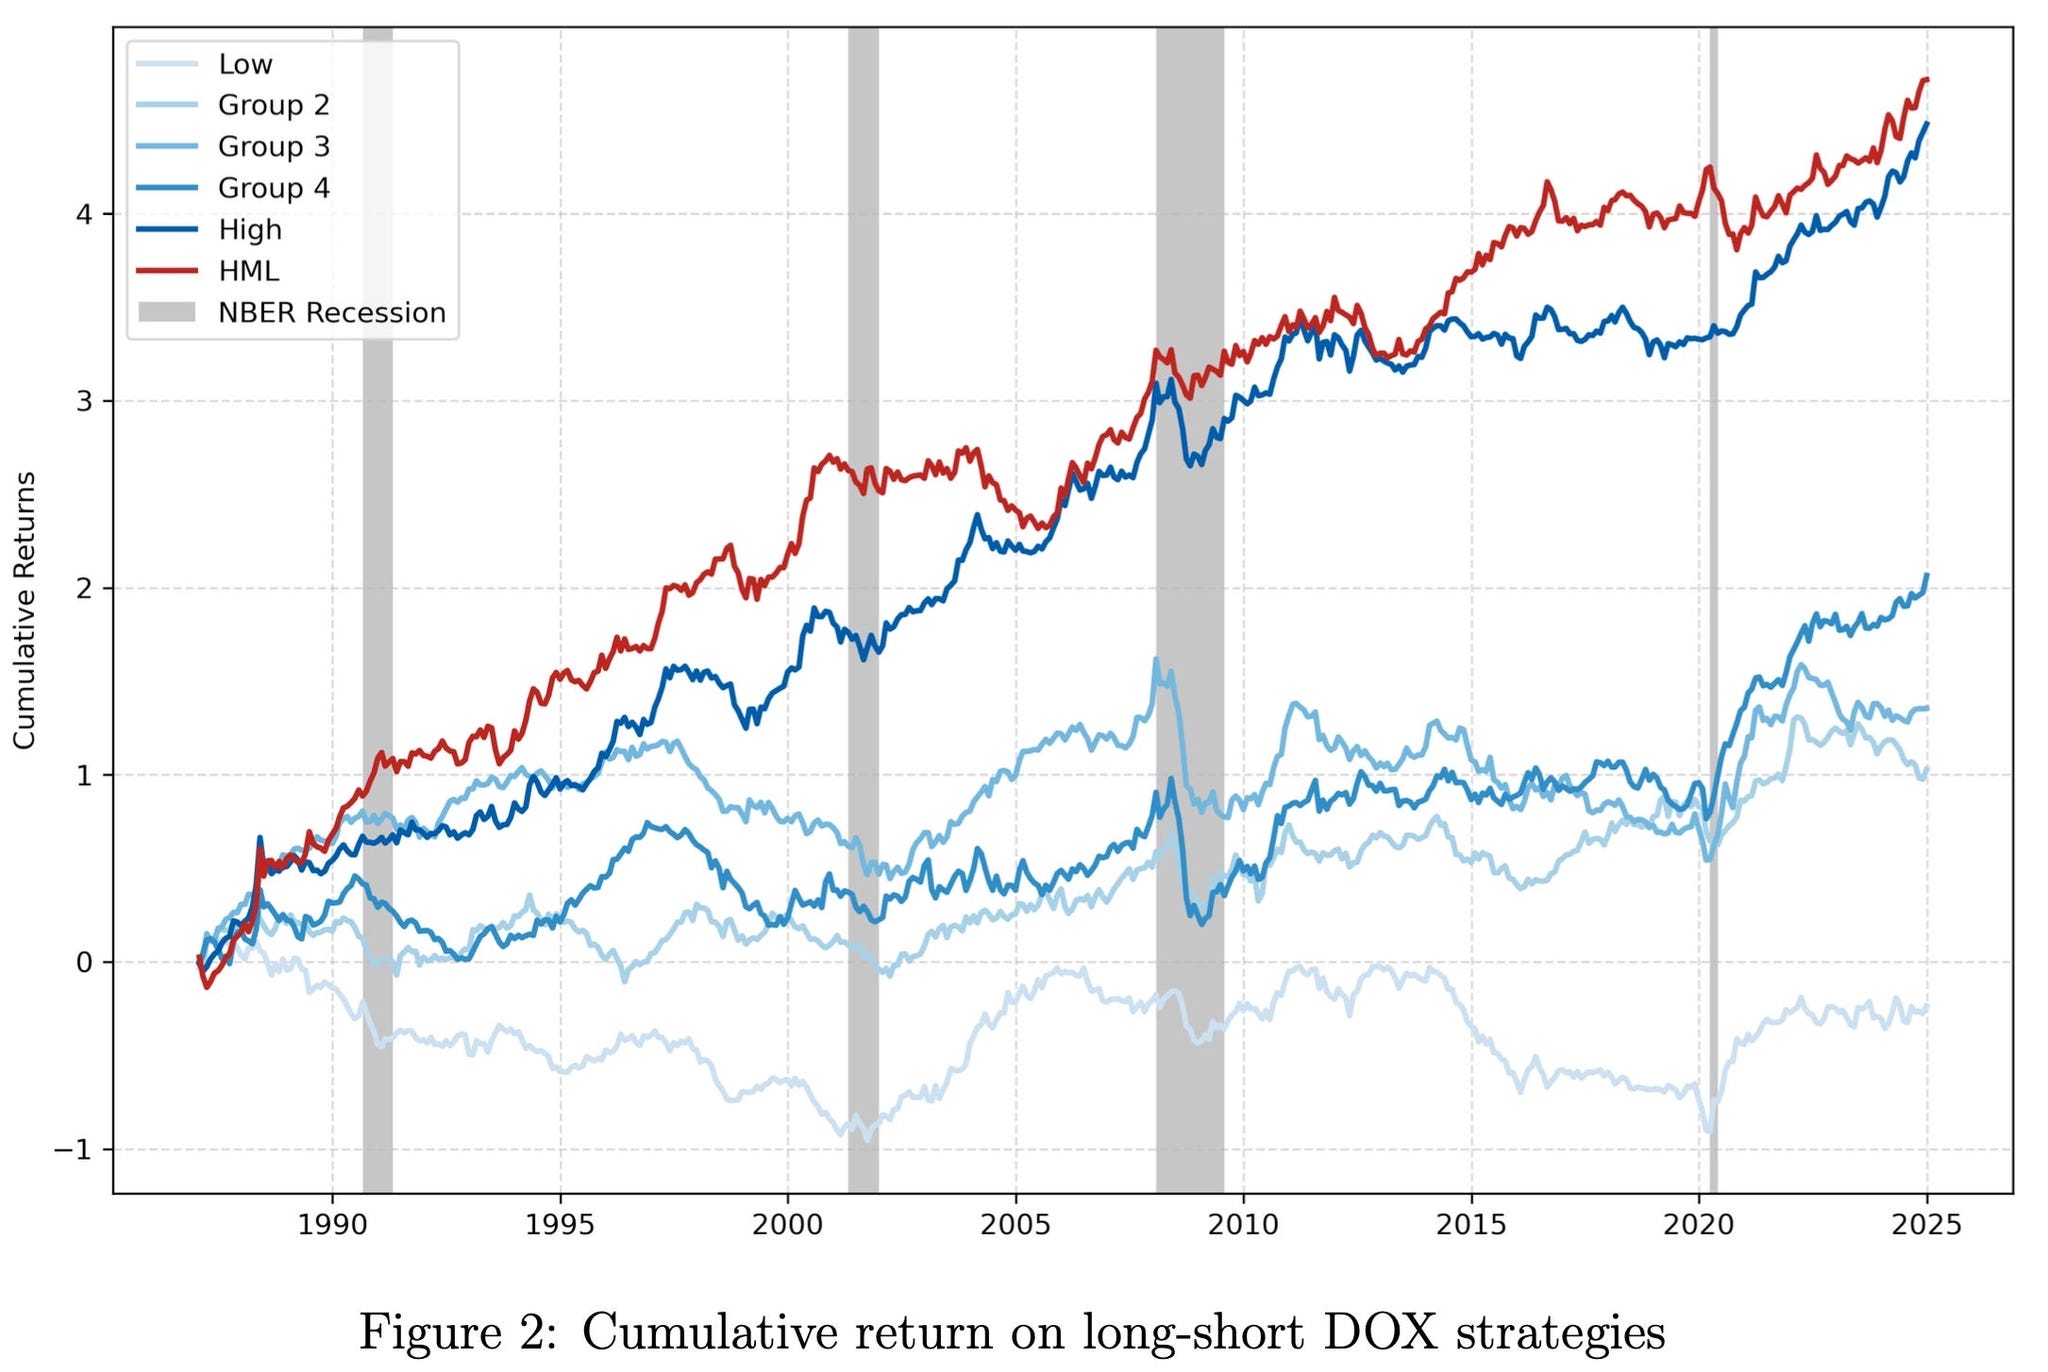
Extrapolative Commodity Returns
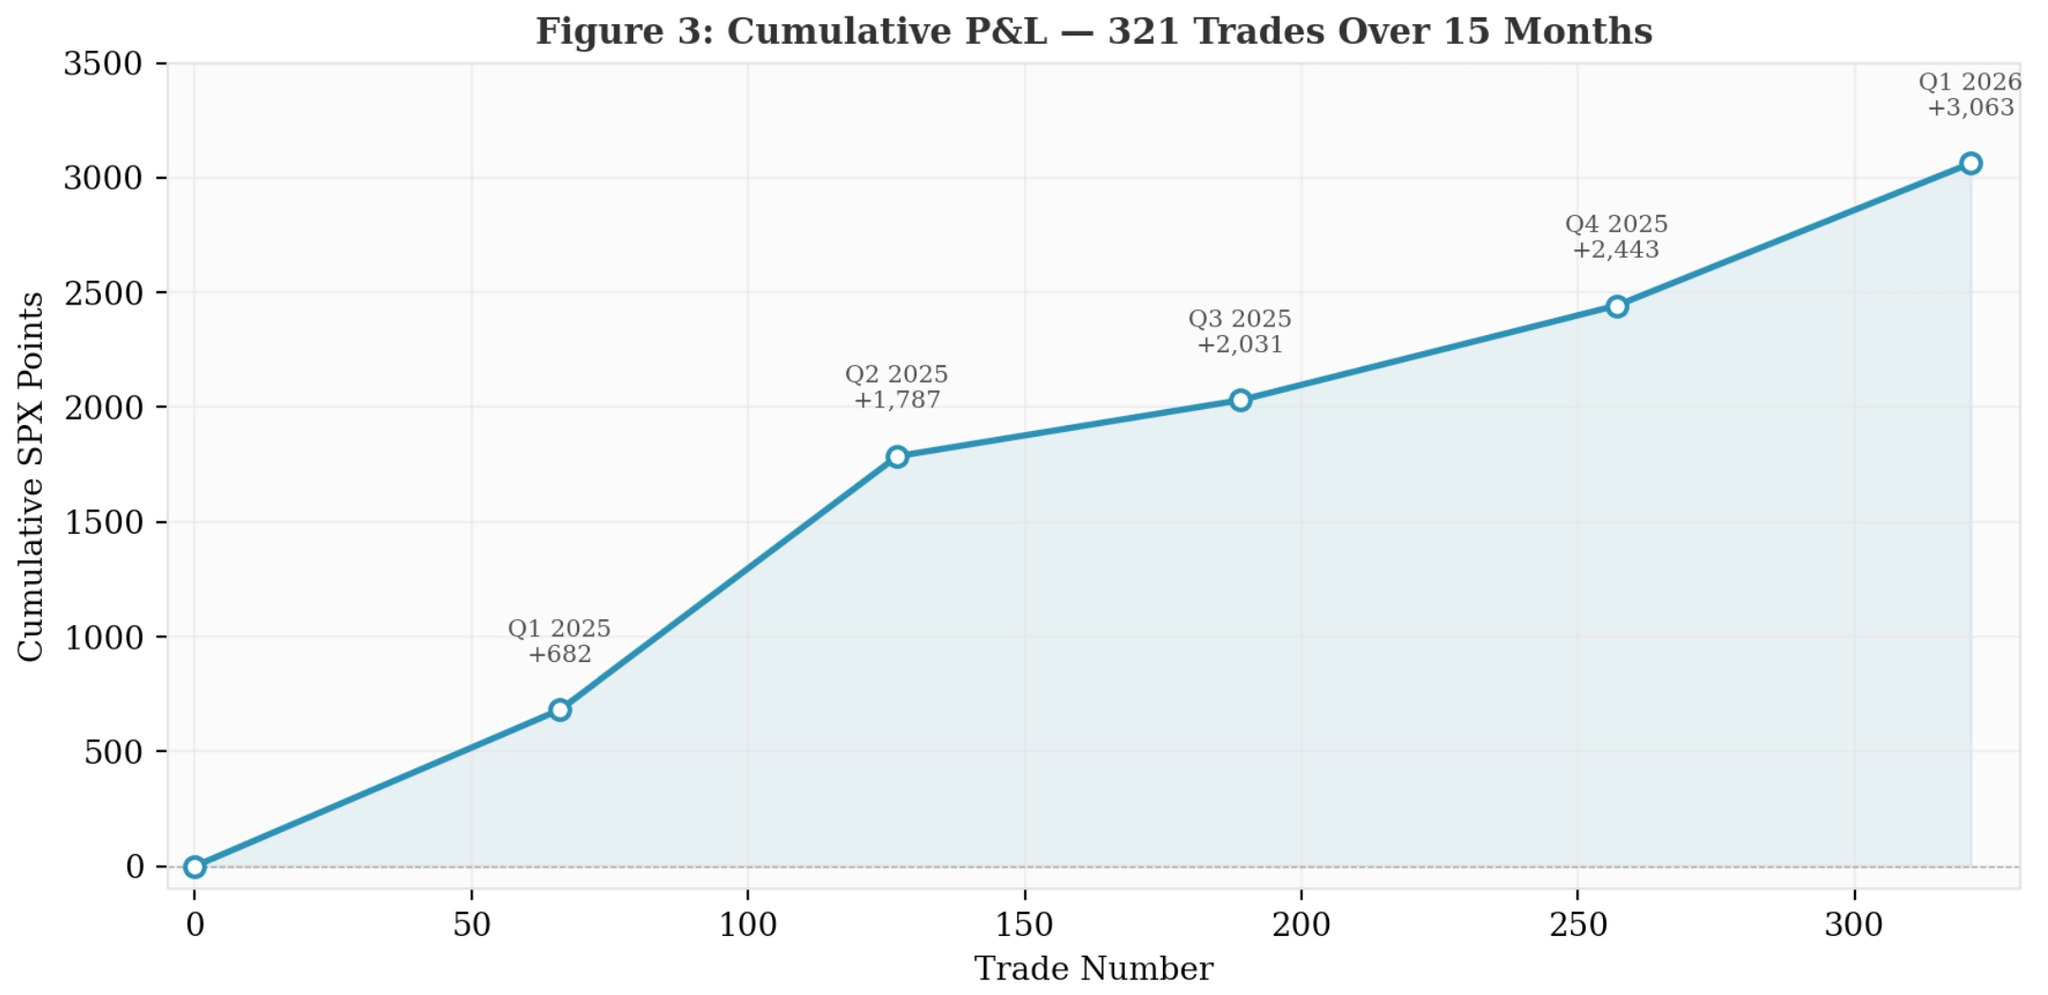
321 trades. 77% win rate. Every quarter profitable.
A new paper conditions S&P 500 directional predictions on dealer gamma regimes, and the results don’t look like noise.
The setup:
A 3-state HMM classifies each day as Pin (dealers long gamma → mean-reversion), Vacuum (neutral), or Accelerant (short gamma → momentum amplification)
Regime-adaptive XGBoost models (one per regime, per direction) predict intraday direction
Two-phase conviction gates filter entries; dealer-flow signals trigger early exits
15 months walk-forward OOS, six near-uncorrelated sleeves
The numbers:
+3,063 SPX points over 321 trades
Profit factor 4.40, max drawdown just 2.2% of cumulative return
Vacuum Long: 92% WR, R/R 2.86
Randomizing regime labels collapses performance to coin-flip → the conditioning is real
The kicker: the simplest model (Pin Long, 13 features, depth-3 trees) has the highest win rate at 81%. Compression regimes are concentrated signals.
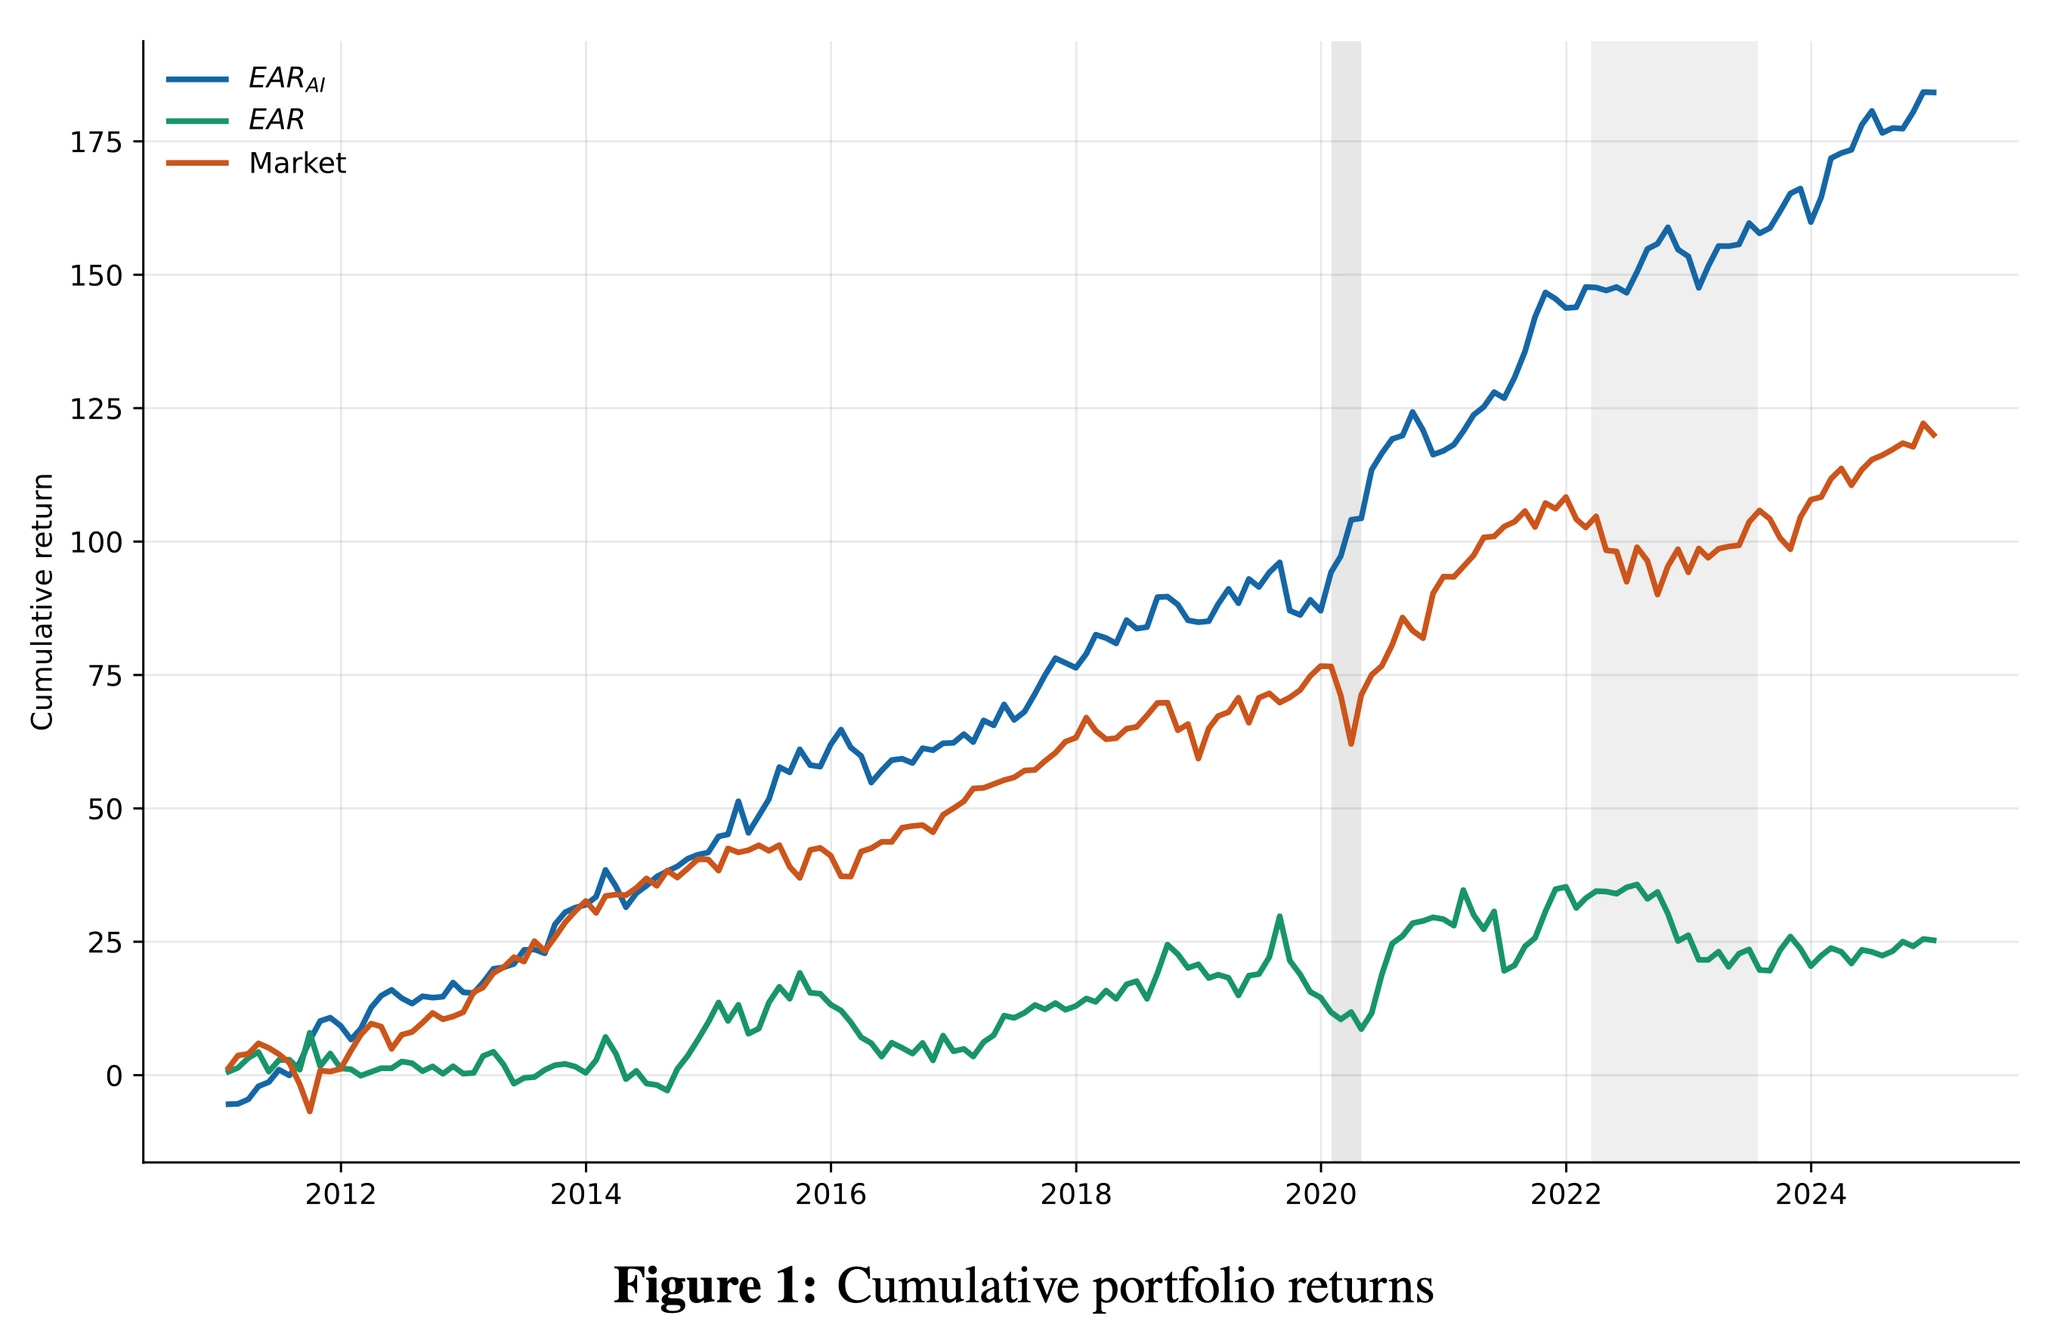
A Sharpe of 2.26. Just from reading earnings call transcripts.
A new paper uses chronologically consistent LLMs (no look-ahead bias) to turn 168,139 earnings calls into a single scalar signal (EAR_AI), and the results are striking:
1.73% monthly long-short return spread
Sharpe of 2.26, robust across every size group (even mega-caps)
Subsumes classical PEAD measures (earnings & revenue surprises)
Predicts future earnings surprises, R&D growth, CapEx, and leverage
Distinct from 125 factor-zoo characteristics, combining it with a ridge SDF lifts Sharpe from 1.45 → 2.7
The mechanism is clean: EAR_AI is a denoised version of the earnings announcement return that isolates forward-looking content from the text. The alpha shows up specifically in firms whose future earnings confirm the signal: it’s putting you on the right side of fundamentals before they’re realized.
Even better, analysts seem to incorporate this content into their forecast revisions, and the returns aren’t explained by aggregate sentiment (so it’s not a behavioral mirage).
Large Language Models for Asset Pricing: Learning from Earnings Calls
1.5 Sharpe. 22% a year. No fundamentals, no supply chains: just prices and a hidden network.
Momentum doesn’t only persist within an asset: it spills over to connected ones. This paper asks a bold question: what if commodities, stocks, bonds, and currencies are secretly linked by their momentum, and you could map those links from price data alone?
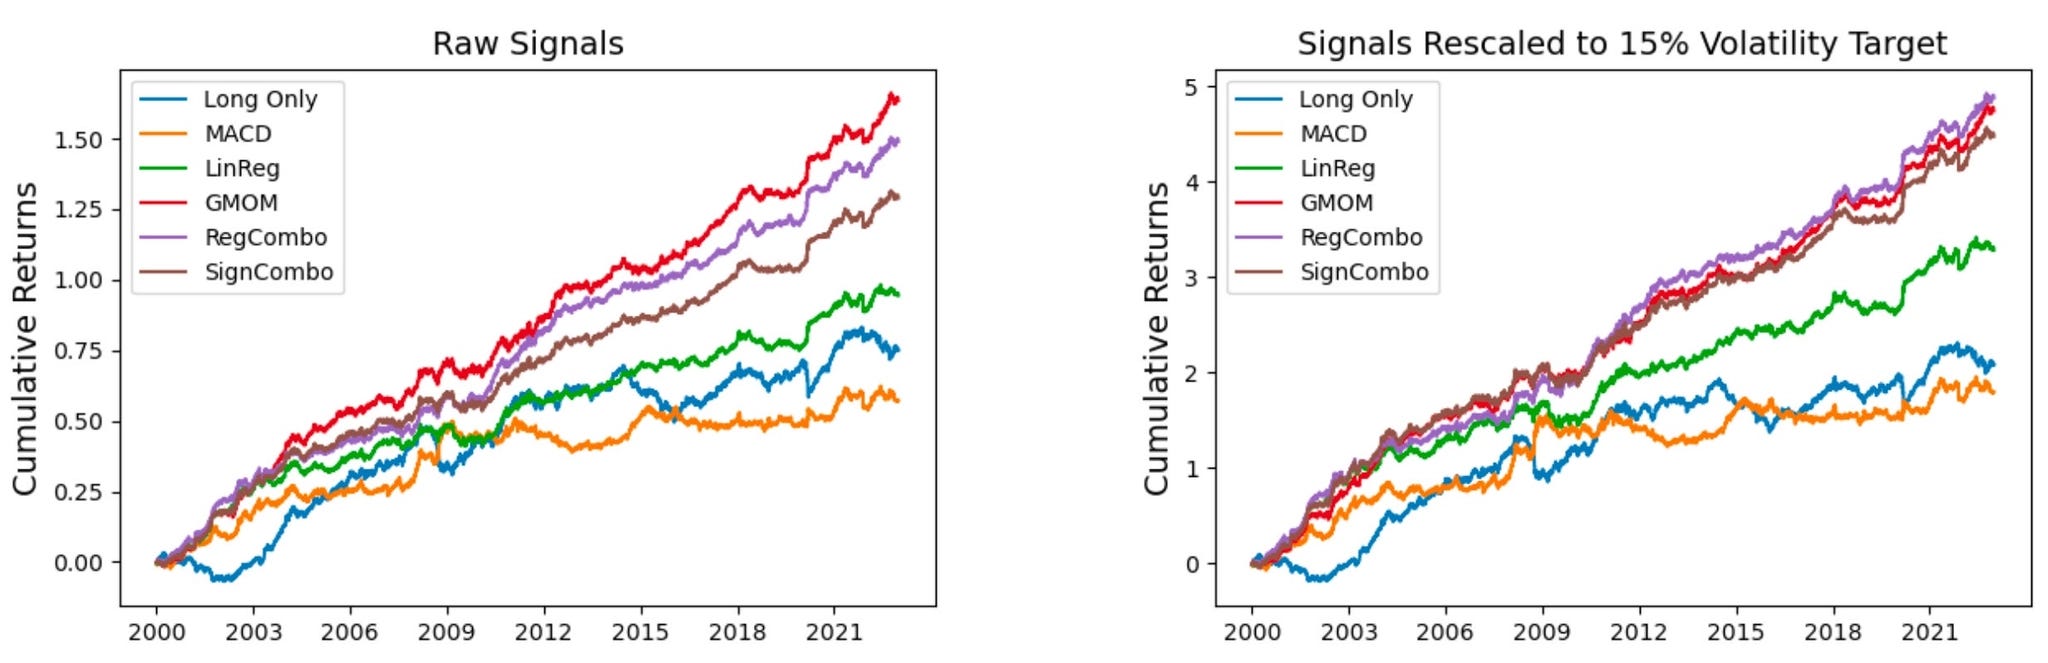
Using graph learning, the authors build a dynamic network across 64 futures contracts in 4 asset classes, then trade the network momentum that propagates through it:
1.51 Sharpe and 22% annual return, out-of-sample from 2000-2022,
Only 65% correlated with classic momentum: a genuinely new signal, not a repackage,
Cross-class links are the edge: connecting bonds → currencies → commodities beats trading each class in isolation,
Networks stay remarkably stable, yet visibly reshuffle during the 2008 crisis and the 2020 crash.
No economic ties. No company data. Just prices, a graph, and a regression.
Network Momentum across Asset Classes
As always, I’d love to hear your thoughts. Feel free to reach out via Twitter or email if you have questions, ideas, or feedback.
Cheers!
Really good roundup.
What I liked most is that most of these papers are not trying to reinvent everything. They take familiar ideas like momentum, trend or positioning and look at them through one extra lens that actually changes the result.
The tick-size paper was probably the most interesting to me. It gives a plausible explanation for why some forms of short-term trend weakened while others survived.
Also appreciated that you included the limits, especially where the headline results are much bigger than what is realistically tradable. That makes the research much more useful.