Uncertainty
A probabilistic approach to momentum to deliver +1.7 Sharpe ratio


The idea
“Doubt is not a pleasant condition, but certainty is a ridiculous one.” Voltaire
Voltaire was arguably the most influential intellectual of 18th-century France. More than that, he was a provocateur. He spent his life as a one-man war against dogma, against anyone who claimed to know the truth with absolute certainty. The Age of Enlightenment didn’t begin with answers: it began with Voltaire’s refusal to accept false certainties.
After three articles on more original ideas, we return this week to paper implementations. In fact, this week we will discuss two papers with a simple yet powerful idea at their core: that embracing uncertainty (rather than fighting it) leads to better results.
We will investigate the ideas in the paper Bimodality Everywhere: International Evidence of Deep Momentum, by Chulwoo Han and Chang Qin, published in December 2025. This paper is an extension of Bimodal Characteristic Returns and Predictability Enhancement via Machine Learning, also by Chulwoo Han, published in October 2022.
Here’s our plan:
First, we will quickly summarize the papers
Next, we will create a simple trading strategy based on this idea and show its strong results
Finally, we will wrap up with final thoughts and next steps
Before we start, two messages.
First, the 3rd cohort of the course is still open for enrollment for the next couple of days.
I created this to respond to a request I’ve received from hundreds of readers here: access to my codebase, step by step — for those who want to develop strategies using the same approach I share here. Enrollment also includes access to the private community and an ever-growing library of study groups. More information at the link below.
Last day for enrollment in the 3rd cohort: Apr 7.
Second, this time it took me a bit longer than the usual 3-4 weeks to write and publish. There are a few reasons why:
First and foremost, I implemented distinct papers, and their results came in significantly below what was reported. Instead of publishing subpar ideas, I prefer to keep searching for meaningful ones to share. That’s why I’ll never promise a rigid schedule — sometimes the search takes longer, but I’ll never compromise quality.
And, of course, just a lot of regular work :)
Welcome to all new subscribers — and rest assured: even if it sometimes takes a little longer than the usual 3-4 weeks to publish, the work continues non-stop.
Paper summary
Core Idea
Most investors who use momentum strategies assume a simple, intuitive relationship: past winners will likely continue to win, and past losers will likely continue to lose. If that were true, the return distribution of high-momentum stocks would look like a hill (i.e., most returns clustered around the high end).
But that’s not what the data shows.
Chulwoo Han’s paper documents a striking and uncomfortable fact: both high- and low-momentum stocks have bimodal return distributions. Past winners are most likely to yield high returns, but their second most likely outcome is to yield very low returns. The same is true, in reverse, for past losers.
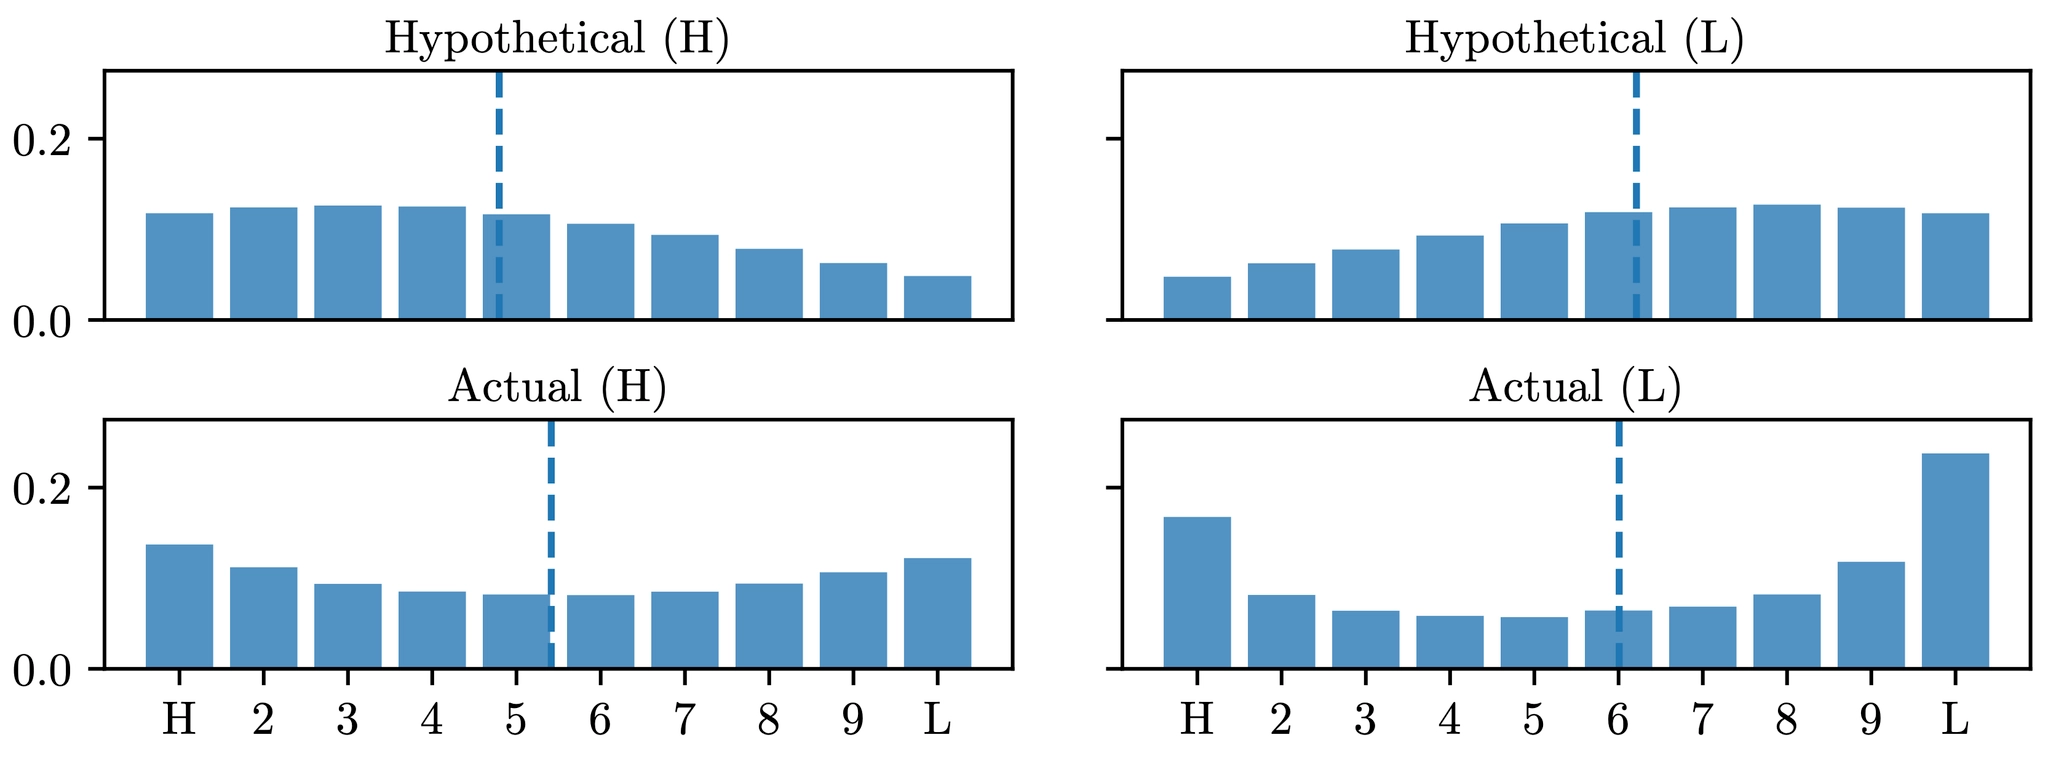
This is not a hill. It’s a U-shape.
The implication is profound. The momentum strategy is not just risky in the conventional sense: it is fundamentally risky, because the stocks it bets on are precisely the ones most likely to deliver extreme outcomes in either direction.
And here’s what makes it even more interesting: this bimodality is not unique to momentum. It appears across virtually every major firm characteristic — beta, size, book-to-market, volatility, etc. It’s everywhere.
The Problem with Standard Machine Learning
Neural networks trained on momentum features do outperform the standard momentum strategy. This has already been shown by many different authors. But they don’t eliminate the bimodality. And here’s where the paper identifies a subtle but critical flaw in how machine learning is typically applied to finance.
A standard neural network predicts the most probable return class for each stock. But when return distributions are bimodal, the most probable class is not the same as the expected return.
A stock with a 55% chance of winning and a 45% chance of losing will be labeled a winner. But would you rather own that, or a stock that is 95% likely to earn a modest, predictable return? The model can’t tell the difference. You can.
The model picks one answer and discards all the doubt. That, as Voltaire warned us, is the absurd part. There’s information in the uncertainty. Discarding that is discarding alpha.
Methodology
The paper introduces the Deep Momentum (DM) framework, which fixes this in two steps:
Step 1: Estimate the full distribution. A deep neural network classifies each stock into return deciles and outputs a probability for each decile, not just a single predicted class. This gives a complete picture of each stock’s return uncertainty.
Step 2: Reclassify based on financial performance. Rather than selecting stocks on the most probable class, the model reclassifies stocks using their expected return, computed as a probability-weighted average across all deciles. Five reclassification methods are proposed, ranging from simple ranking adjustments to Sharpe ratio optimization.
The inputs are intentionally simple: normalized price momentum features over 1, 3, 6, 9, and 12 months, plus size dummies. No exotic data. No hundreds of factors. Models are tested on US stocks from 1975 to 2017, with all experiments repeated fifty times to account for randomness in neural network training.
Main Findings
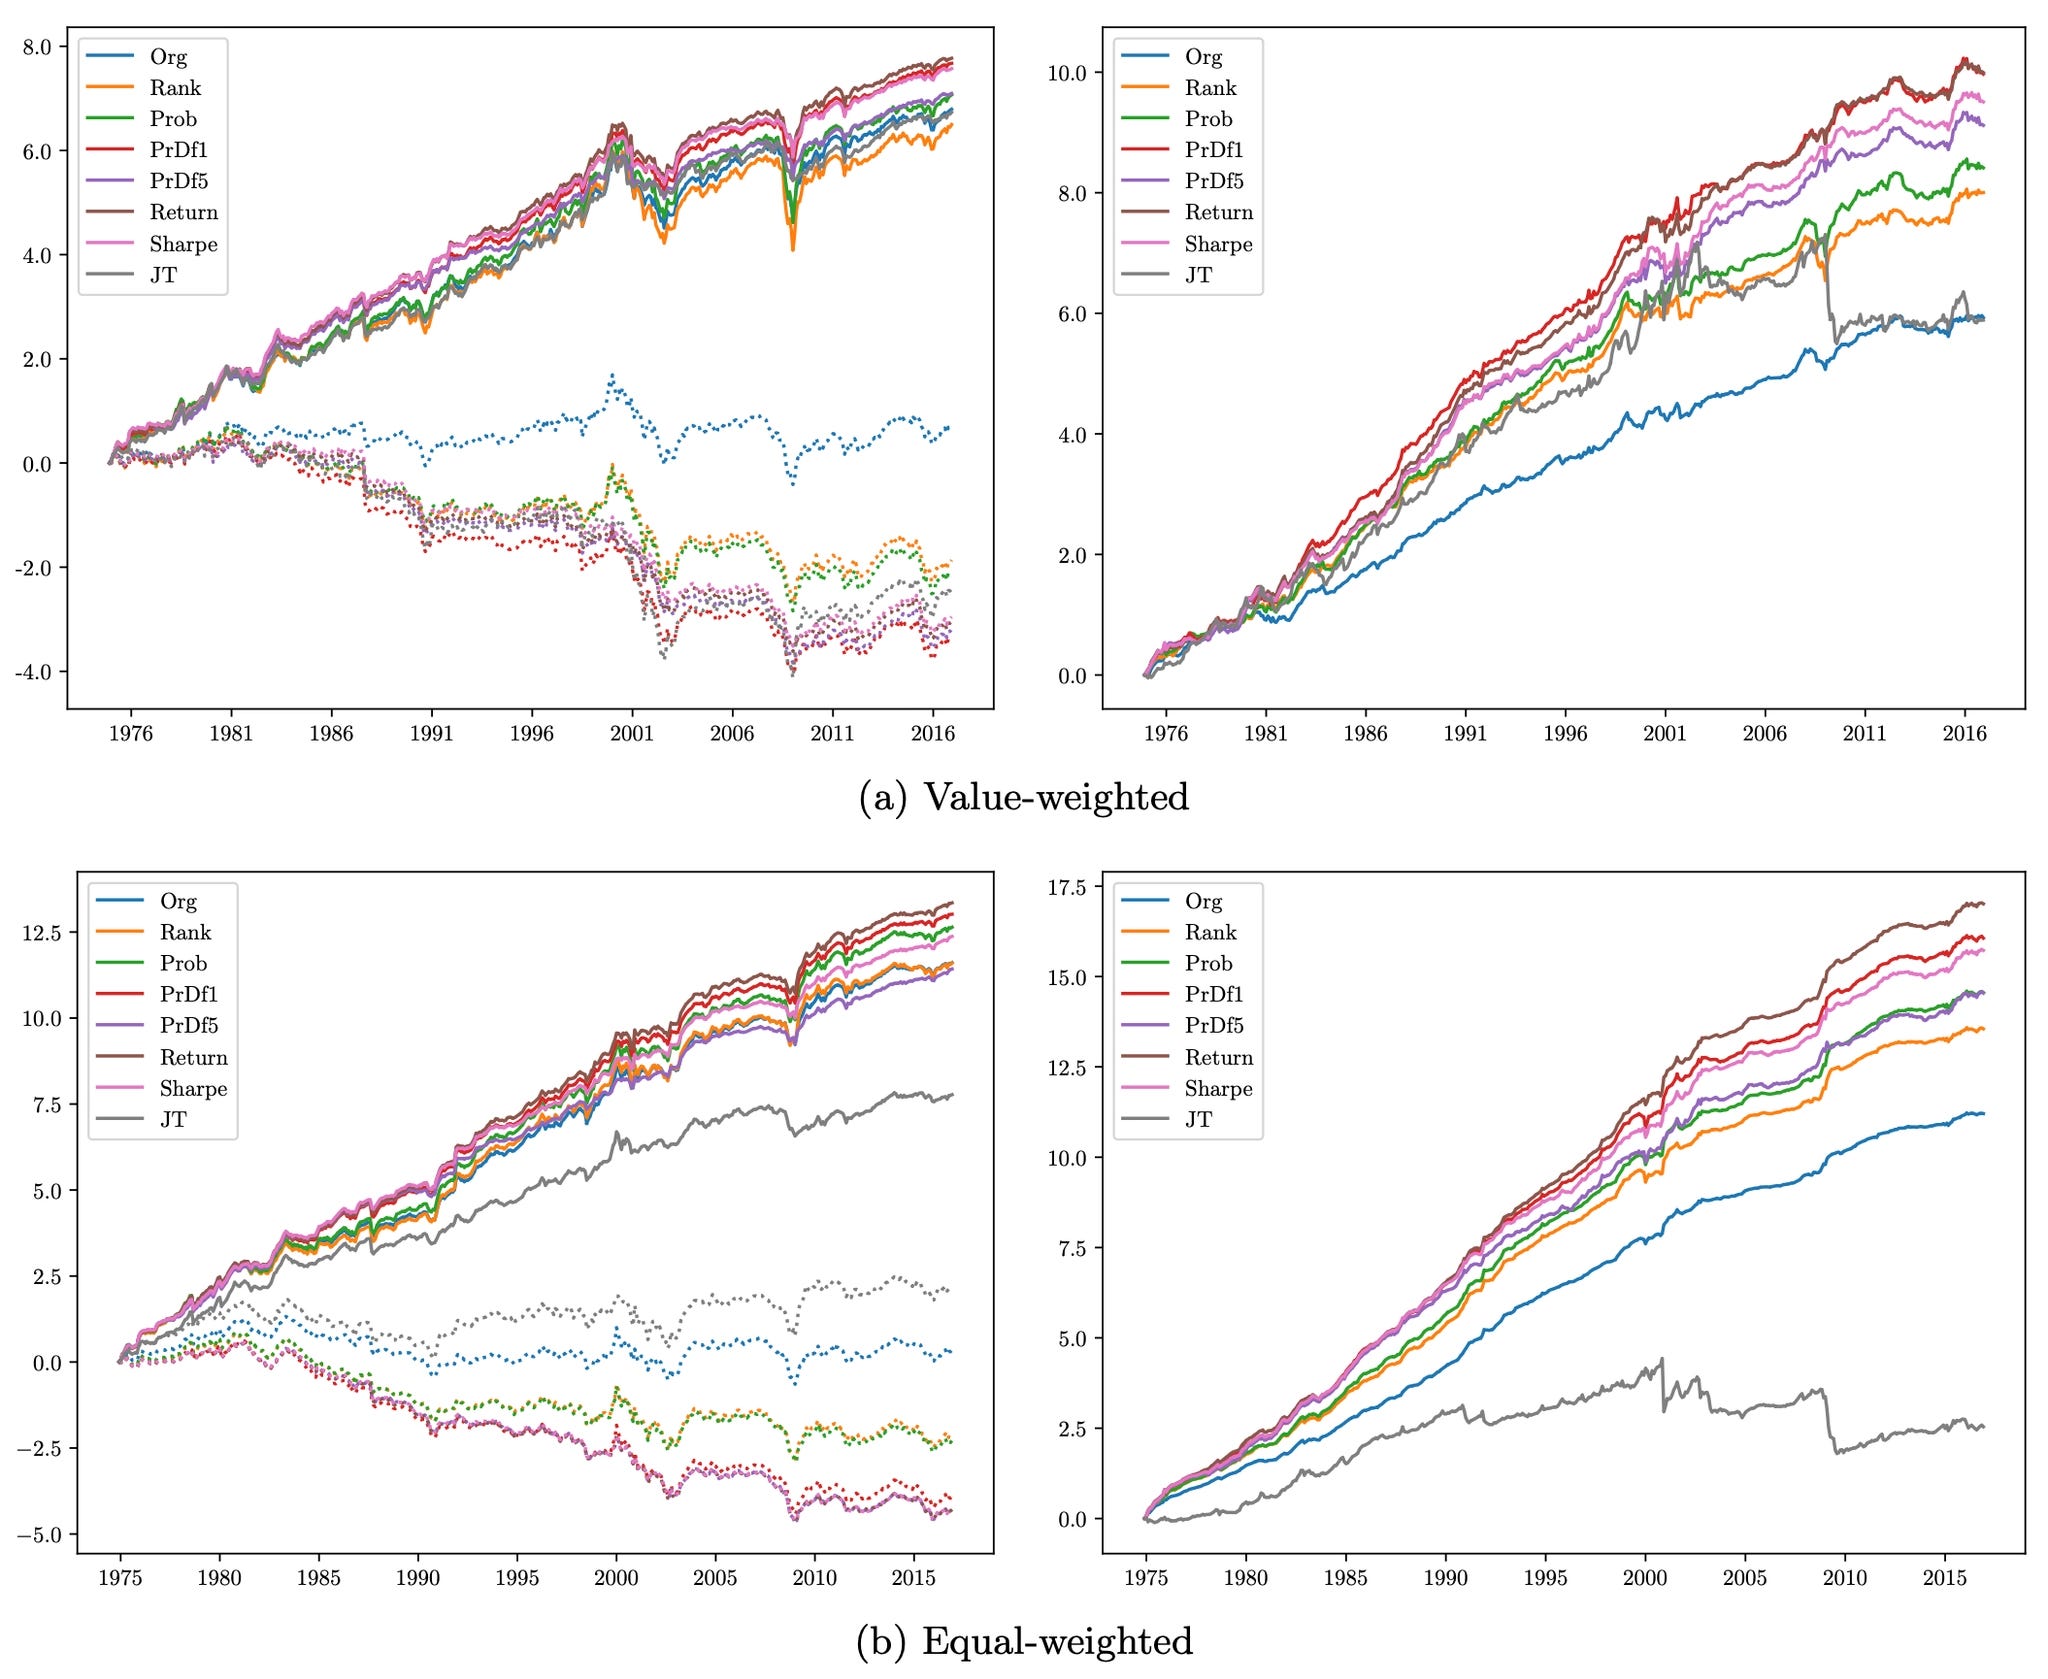
The results presented in the paper are remarkable:
A value-weighted long-short portfolio earns an annualized return of 35% and a Sharpe ratio above 1.6.
An equal-weighted version earns around 50% annualized with a Sharpe ratio above 2.8.
The standard momentum strategy, for comparison, yields a Sharpe ratio of 0.61. The best-known improvement (Barroso and Santa-Clara, 2015) reaches 1.00. The DM strategy more than doubles it.
The monthly alpha is 2.4% (t-statistic = 6.63) after controlling for Fama-French five factors plus momentum and short-term reversal. The factors cannot explain the returns.
No momentum crashes. The model appears to learn from past crash patterns and repositions accordingly.
The strategy survives transaction costs. Under 30 basis points, the value-weighted portfolio still earns 23% annualized with a Sharpe ratio of 1.09.
Conclusion
The paper makes two contributions that stand on their own.
The first is empirical: the discovery that momentum stocks (and most characteristic-sorted stocks) have bimodal return distributions. A new way of understanding why these strategies are risky at the stock level, not just at the portfolio level.
The second is methodological: machine learning classifiers, when applied naively, optimize for the wrong objective. Predicting the most probable class is not the same as predicting the best financial outcome. The reclassification framework bridges that gap, and the performance improvement is dramatic.
The beauty of the result is in its simplicity. A small number of features. A clean methodology. Results that outperform models using hundreds of inputs.
The second paper
The first paper proved the concept in the US market. The latest one asks the harder question: Does it work everywhere else?
Han and Qin extend the Deep Momentum framework to 45 countries, testing it against a wide range of markets — developed and emerging, deep and shallow, high-momentum and low-momentum. The results are striking.
What’s new in this paper
Scale. The original paper was US-only. This one covers 45 countries, using data from Refinitiv’s Datastream going back as far as 1965 for the US and UK.
A new classifier. Instead of a deep neural network, this paper uses XGBoost (a gradient-boosted tree model). The reason is practical: training a neural network for 45 separate country models would be computationally expensive. XGBoost performs comparably with far less tuning.
A new question: why does bimodality vary across countries? The paper doesn’t just document bimodality internationally: it tries to explain it. The key drivers turn out to be behavioral: individualism and the disposition effect (the tendency of investors to sell winners too early and hold losers too long).
Joint learning. This is the most original methodological contribution. Instead of training one model per country, the paper trains a single global model on data from all 45 countries simultaneously. The global model outperforms country-specific models in most cases (including in the US).
Main Findings
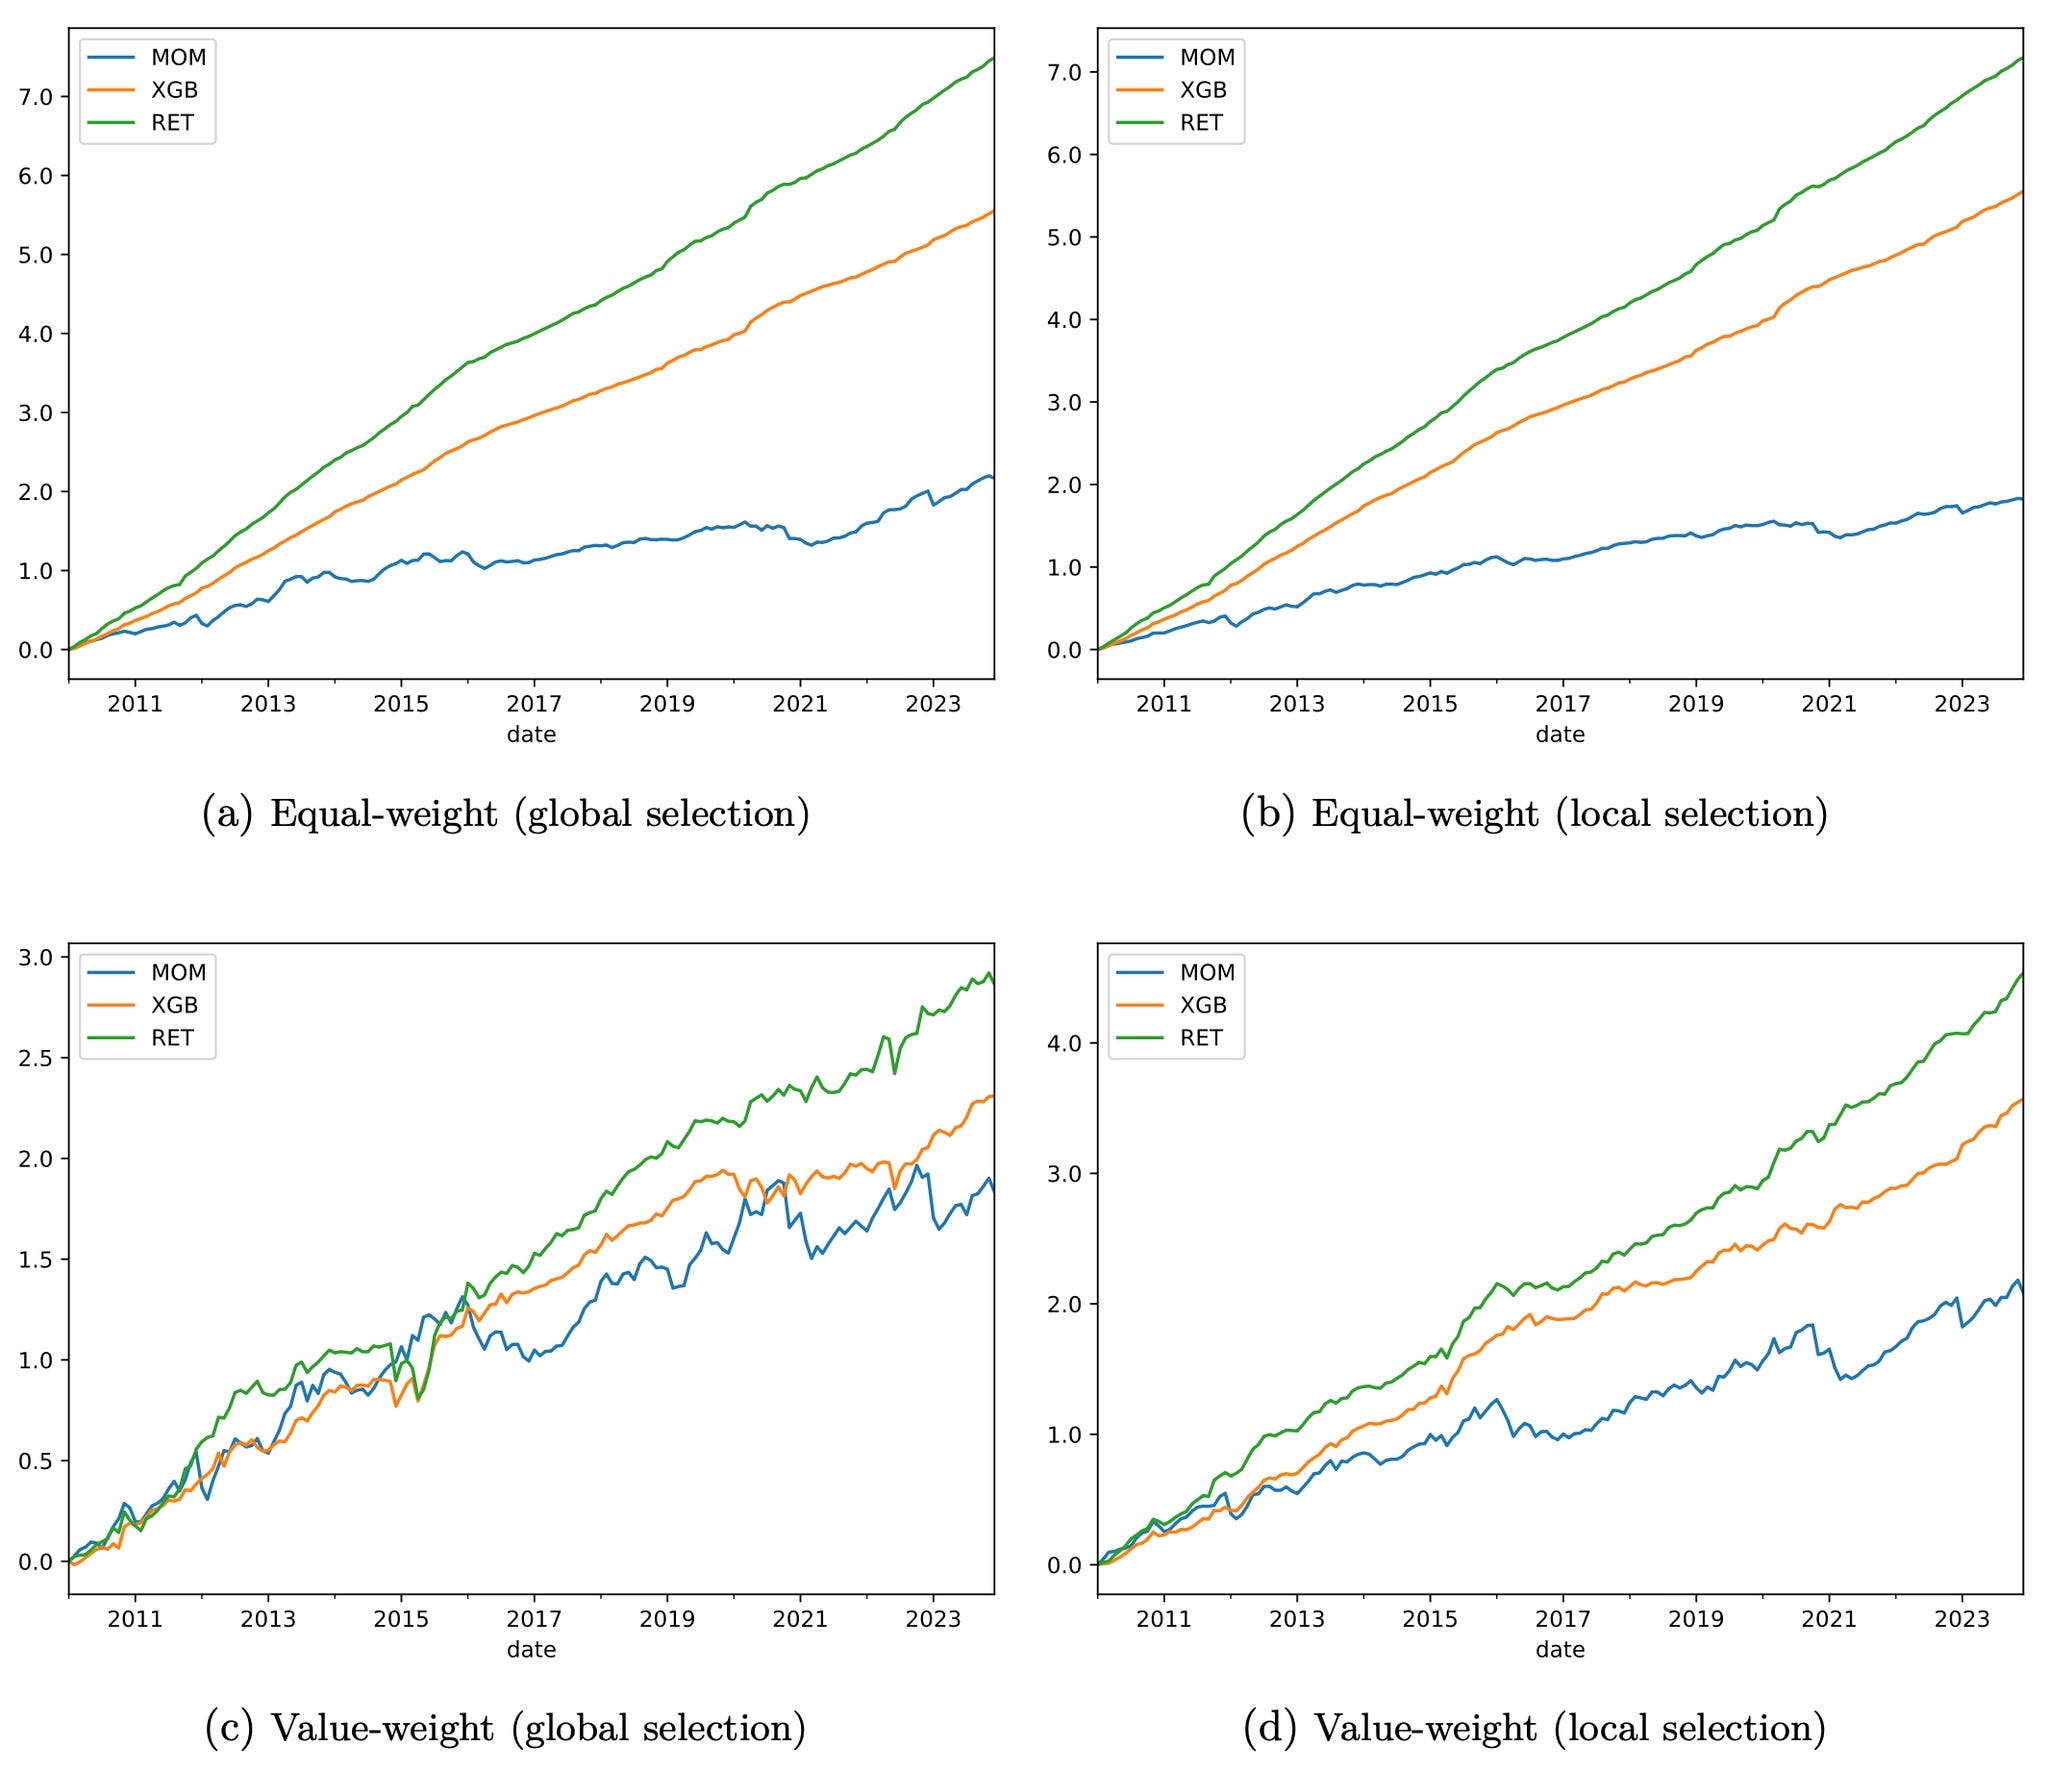
Bimodality is widespread and persistent across all 45 countries. It is not a US quirk.
Bimodality is negatively correlated with momentum profits, meaning that where bimodality is highest, the standard momentum strategy works worst. This is especially visible in Asian markets like China, Japan, and Korea.
Deep Momentum (RET) doubles the return of standard momentum on average across countries. Equal-weighted annualized mean returns: MOM 20.9%, XGBoost 31.1%, RET 41.4%. Average Sharpe ratios: MOM 0.98, XGBoost 2.13, RET 2.49.
RET outperforms XGBoost in 43 out of 45 countries. The reclassification step (translating probabilities into expected returns) is the dominant source of improvement.
In Asian markets where momentum historically fails, Deep Momentum shines. In China: MOM 2.0%, RET 31.5%. In Japan: MOM 2.2%, RET 22.2%. In Korea: MOM -0.2%, RET 46.1%.
The global model is exceptional. Equal-weighted, it earns an annualized return of 52.9% and a Sharpe ratio of 8.98. Value-weighted: 33.8% return and a Sharpe ratio of 2.81. The authors note that achieving such a high value-weighted Sharpe ratio is extremely rare in recent periods.
The global model also improves country-level portfolios in 38 out of 43 countries (including the US) by learning patterns from markets that individual countries have not yet experienced.
Why does Deep Momentum work better in some countries than others?
The paper finds that machine learning strategies outperform most in countries with:
Higher bimodality
Larger stock universes (cross-sectional depth matters more than time-series length)
Higher volatility
Higher turnover
In high-bimodality countries, one-year momentum loses predictive power, but short-term reversal becomes stronger (and the model learns to exploit that).
The bottom line: bimodality is not a statistical curiosity confined to the US. It is a global phenomenon, rooted in investor behavior, and Deep Momentum is a robust framework for turning that uncertainty into alpha — across markets, across cultures, and across history.
Implementing the idea
I will be honest: when I first read these papers, I thought the implementation would be straightforward. It wasn’t. Getting this to work required far more engineering than I thought. Detailing all of that would take an article longer than this one.
And frankly, I have been thinking for a while about shifting the format of these articles. Less “here is exactly how to replicate this,” more “here is the idea, here is the evidence, here is what I found.” The reasons for that are obvious. For those of you who want to go further, the papers are your starting point. The rest is yours to build.
Here’s what I was able to get:
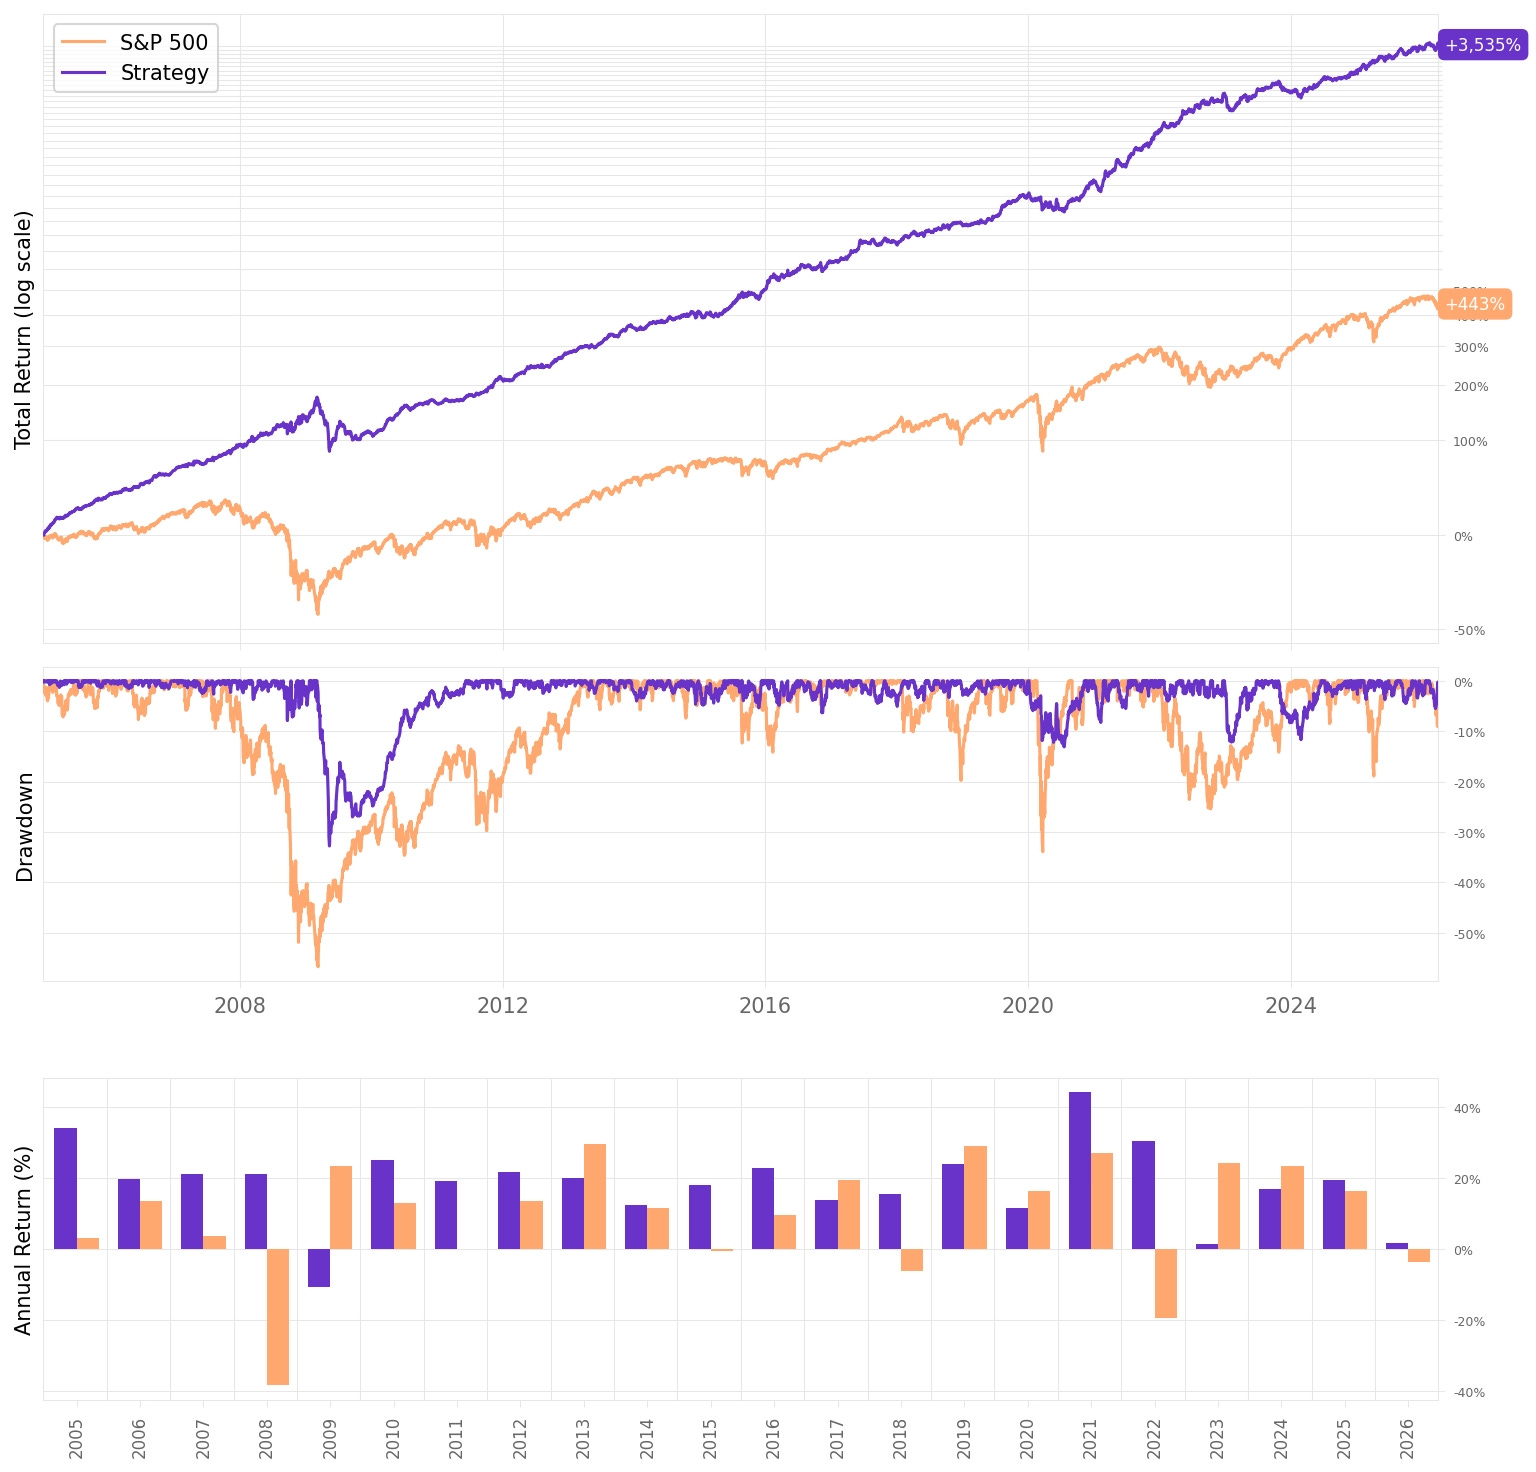
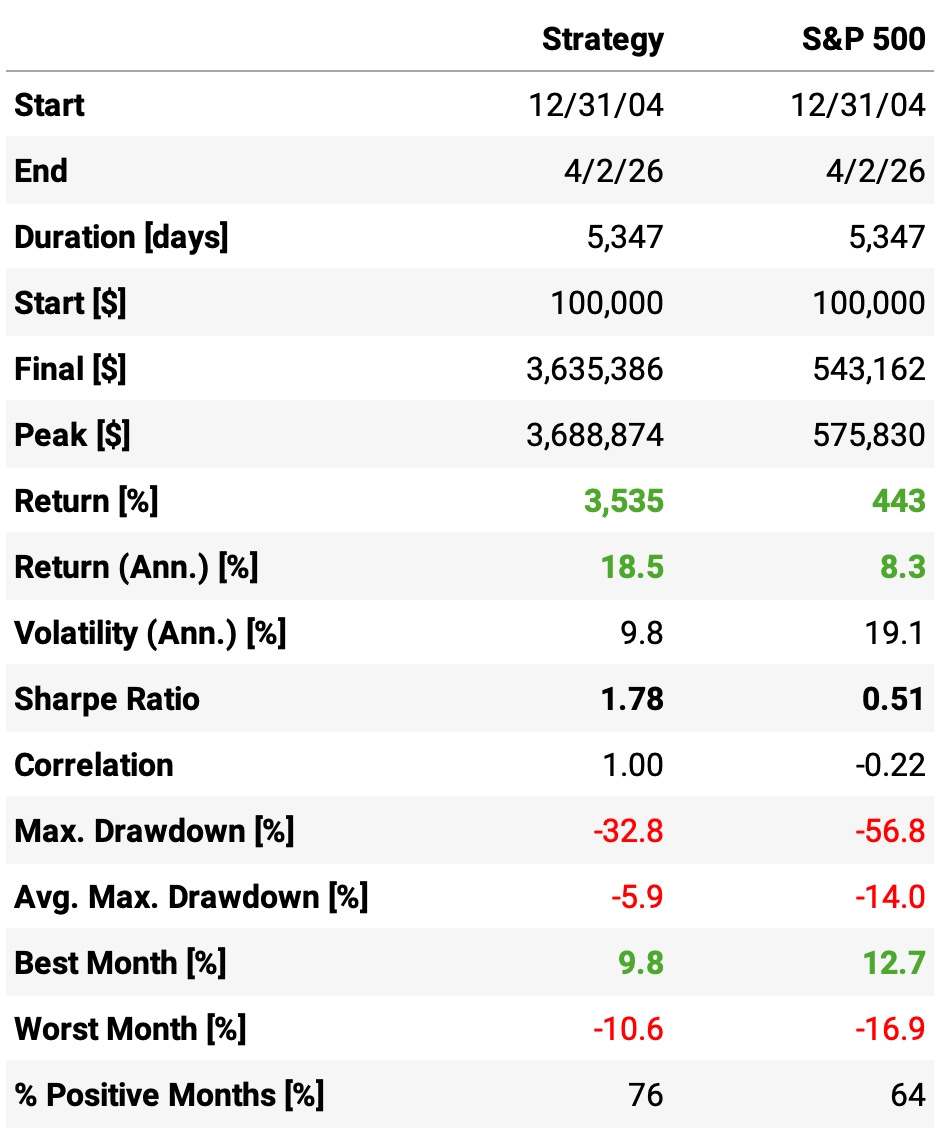
The numbers speak for themselves. But let’s spell them out anyway:
18.5% annualized return with half the volatility of the benchmark. 9.8% vs 19.1%. This strategy doesn’t just earn more. It does it with dramatically less risk.
Sharpe ratio of 1.78. The benchmark sits at 0.51. More than three times the risk-adjusted return.
Max drawdown of -32.8% vs -56.8% for the benchmark. In the worst moments, this strategy gave back roughly half of what buy-and-hold did.
Worst month: -10.6%. The benchmark’s worst month was -16.9%. When things go wrong, they go less wrong here.
76% positive months. Three out of every four months are winners. The benchmark manages 64%.
Correlation to the benchmark: -0.22. Slightly negative. That’s not alpha on top of beta. That’s a genuinely different source of return.
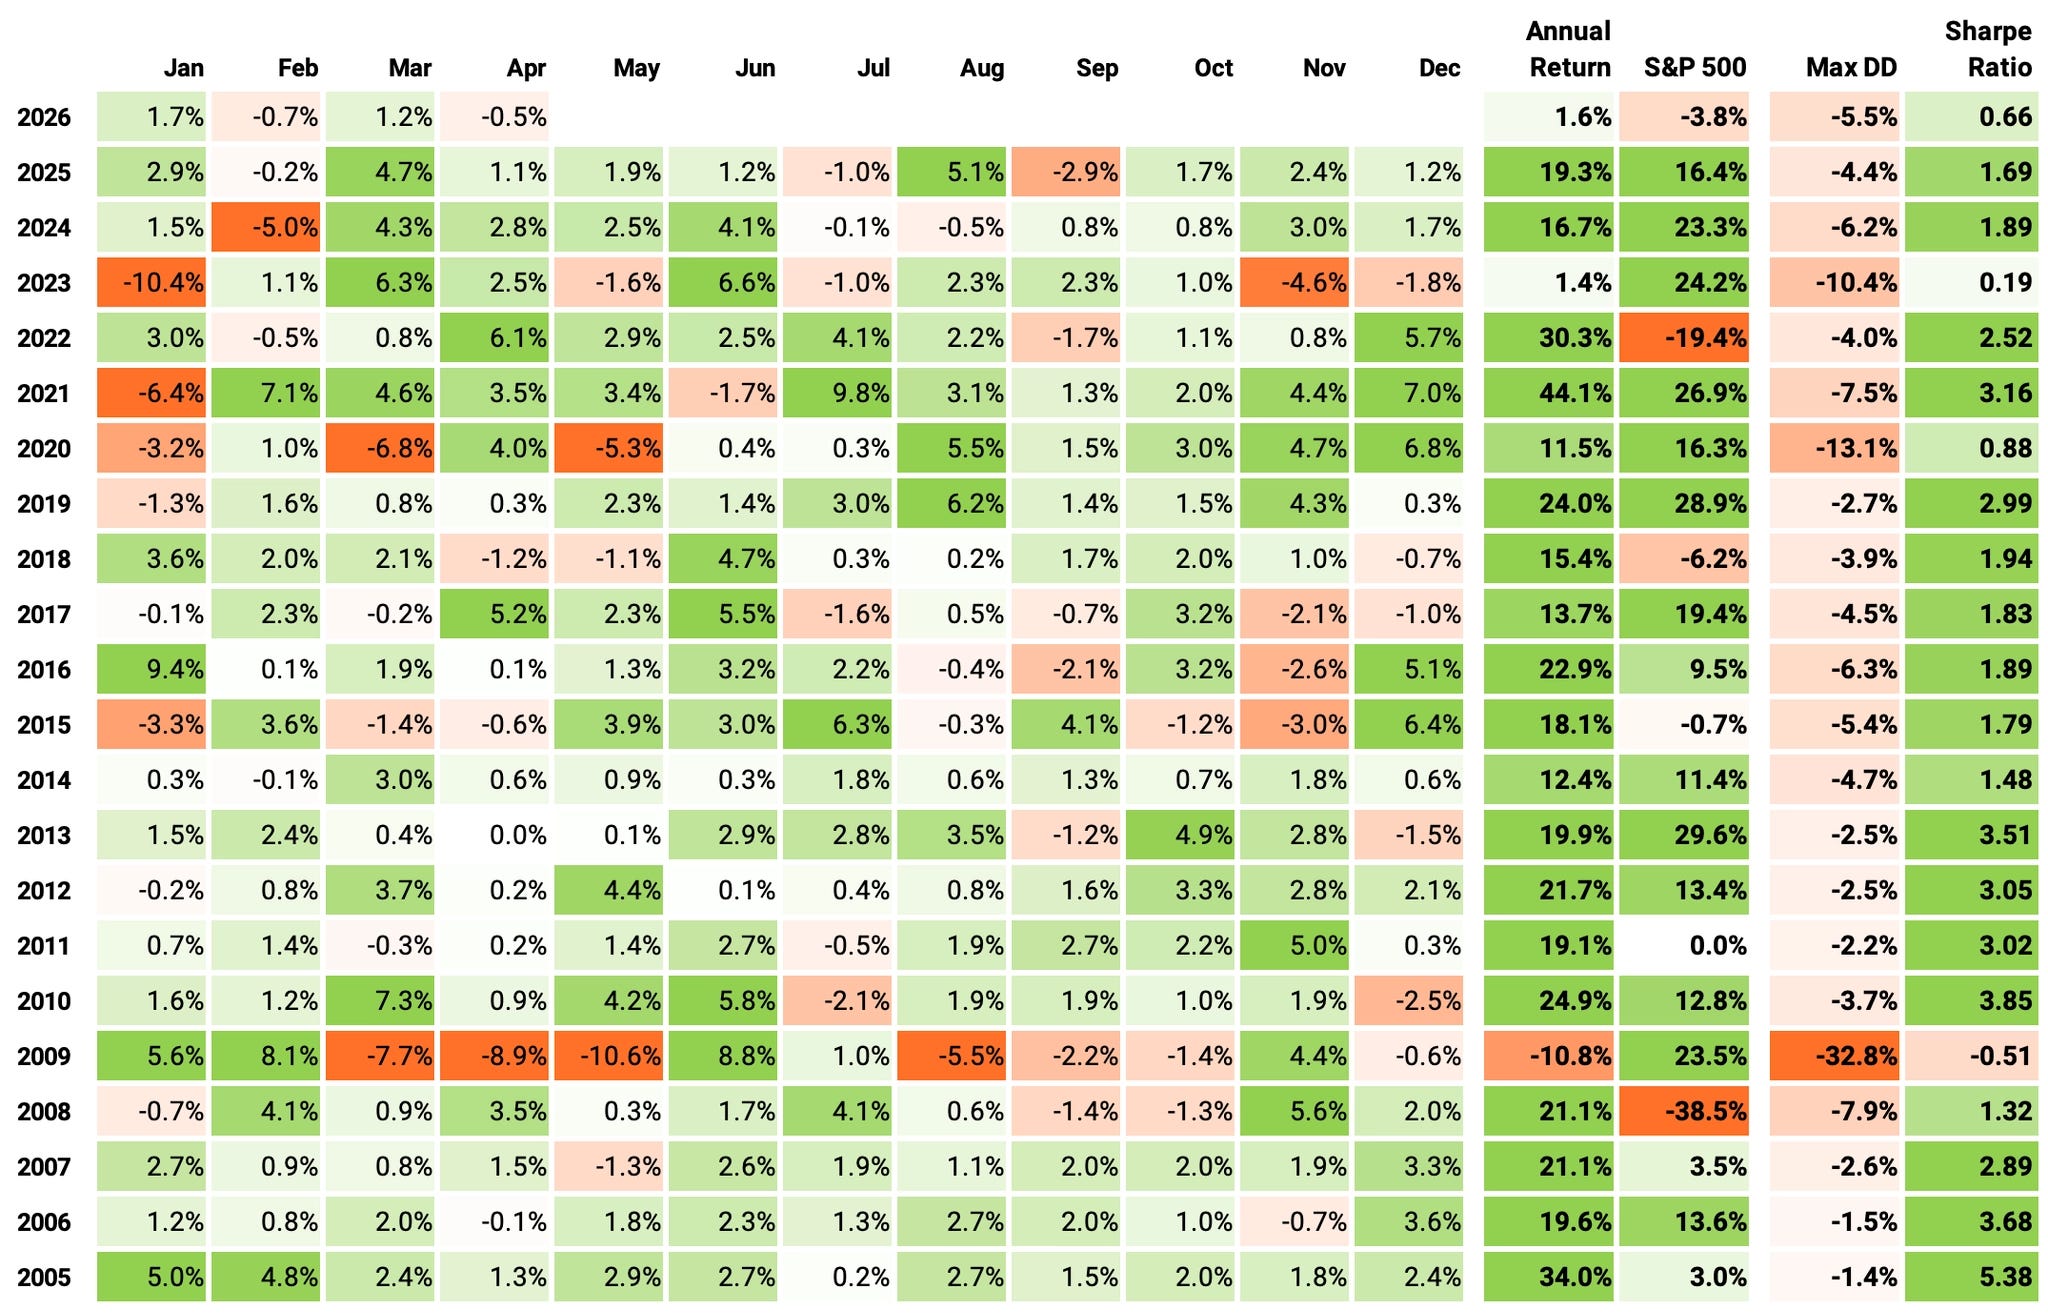
If we had traded this strategy since 2005:
We would have had only 1 negative year (2009);
We would have seen 76% of the months positive, with the best at +9.8% (Jul’21);
We would have seen 24% of the months negative, with the worst at -10.6% (May’09);
The longest positive streak would have been 15 months, from Jan’05 to Mar’06;
The longest negative streak would have been 3 months, from Aug’09 to Oct’09.
Looking at the Fama-French 3-Factor risk model:
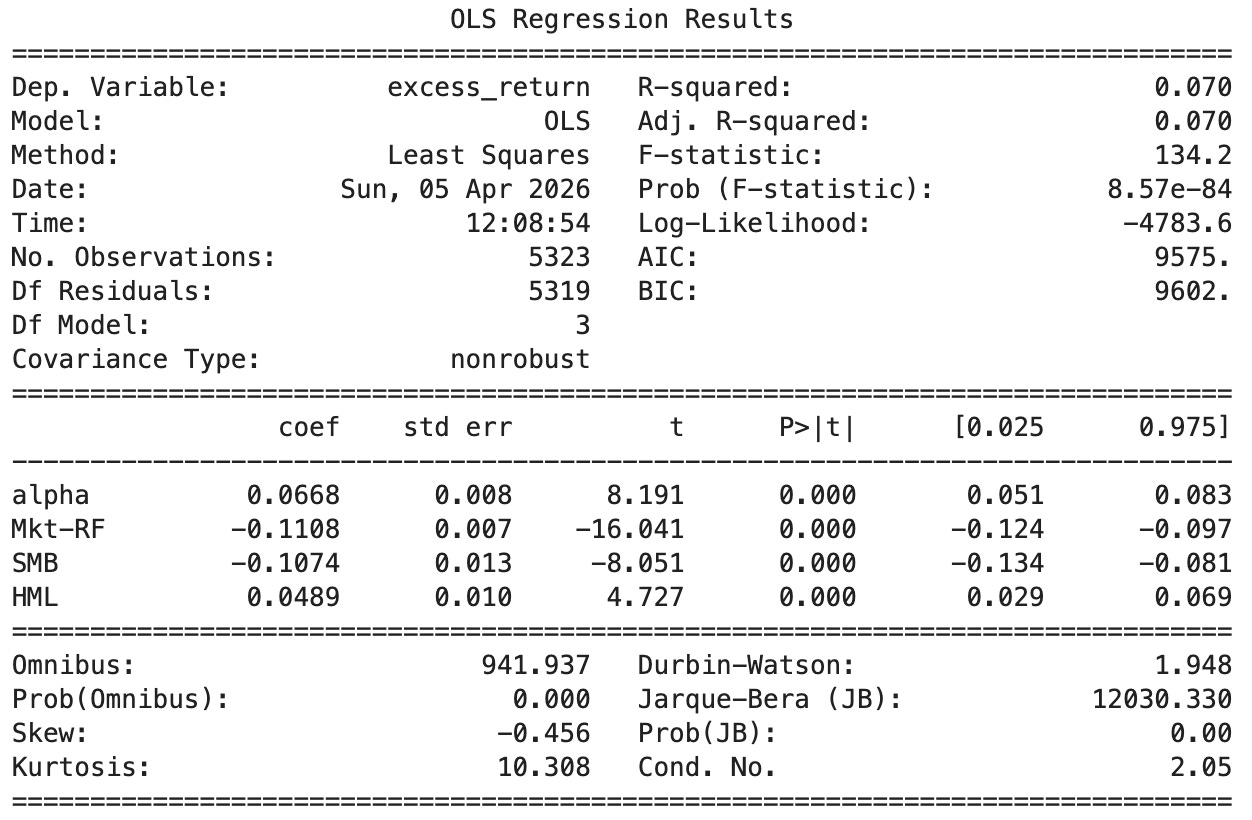
Alpha: 0.0668% per day → annualized ≈ 16.8%, highly significant (t = 8.19, p < 0.001). The strategy delivers strong abnormal returns that standard risk factors cannot explain.
Market Beta (Mkt-RF): -0.111 → negative market exposure (t = –16.04, p < 0.001). The strategy doesn’t just avoid market risk. It actively moves against it. This is what drives that -0.22 correlation to the benchmark.
SMB (Size): -0.107, significant (t = -8.05, p < 0.001). A tilt toward larger stocks. Consistent with an international strategy that avoids the smallest, least liquid names.
HML (Value): +0.049, significant (t = 4.73, p < 0.001). A modest value tilt. The strategy tends to favor cheaper stocks, which is consistent with the momentum reversal dynamics documented in the papers.
R² = 7.0% → only 7% of return variation explained by the three factors. The vast majority of performance is idiosyncratic. The Fama-French factors are nearly irrelevant here.
You can’t ask for more from a market-neutral strategy.
Final thoughts
Voltaire spent his life arguing that certainty is the enemy of truth. Two and a half centuries later, a finance paper proves him right in one of the most quantitatively rigorous ways imaginable.
The insight at the core of these papers is deceptively simple: the information is in the uncertainty. Not in the most probable outcome, but in the full distribution of possibilities. A model that collapses that distribution into a single predicted class is throwing away exactly the signal it needs. The reclassification framework is, at its heart, a way of respecting doubt.
The results speak to how much edge was being left on the table. Doubling the Sharpe ratio of the best-known momentum improvements. Surviving in markets where momentum historically fails. A global model that gets better by learning from countries it has never traded. None of that happens without embracing the full probability distribution.
There is plenty left to explore:
Expanding the feature set. The papers use only momentum and size. What happens when you add valuation, quality, or macro variables to the distribution estimation step?
Combining with other strategies. A negative beta and near-zero correlation to the market makes this a natural diversifier. The obvious next step is blending it into a broader portfolio.
Refining the global model. Joint learning across 45 countries is powerful, but the weighting of countries, the handling of data quality differences, and the retraining schedule all leave room for improvement.
The canvas is wide open.
As always, I’d love to hear your thoughts. Feel free to reach out via Twitter or email if you have questions, ideas, or feedback.
Cheers!
The 3rd cohort of the course is still open for enrollment for the next couple of days.
I created this to respond to a request I’ve received from hundreds of readers here: access to my codebase, step by step — for those who want to develop strategies using the same approach I share here. Enrollment also includes access to the private community and an ever-growing library of study groups. More information at the link below.

Last day for enrollment in the 3rd cohort: Apr 7.
Thanks for the post, great ideas! There are obviously many papers out there, some are good, some are not. Just wonder how did you distinguish those that are insightful vs those that does not worth time to validate?
Great write up. I’m interested in more details of the engineering challenges you faced and how you overcame them? I’m currently implementing this myself and while results are positive, I’m not seeing the performance in the paper yet.